Arab vs Immigrants from Grenada 6th Grade
COMPARE
Arab
Immigrants from Grenada
6th Grade
6th Grade Comparison
Arabs
Immigrants from Grenada
97.0%
6TH GRADE
50.1/ 100
METRIC RATING
173rd/ 347
METRIC RANK
95.9%
6TH GRADE
0.0/ 100
METRIC RATING
295th/ 347
METRIC RANK
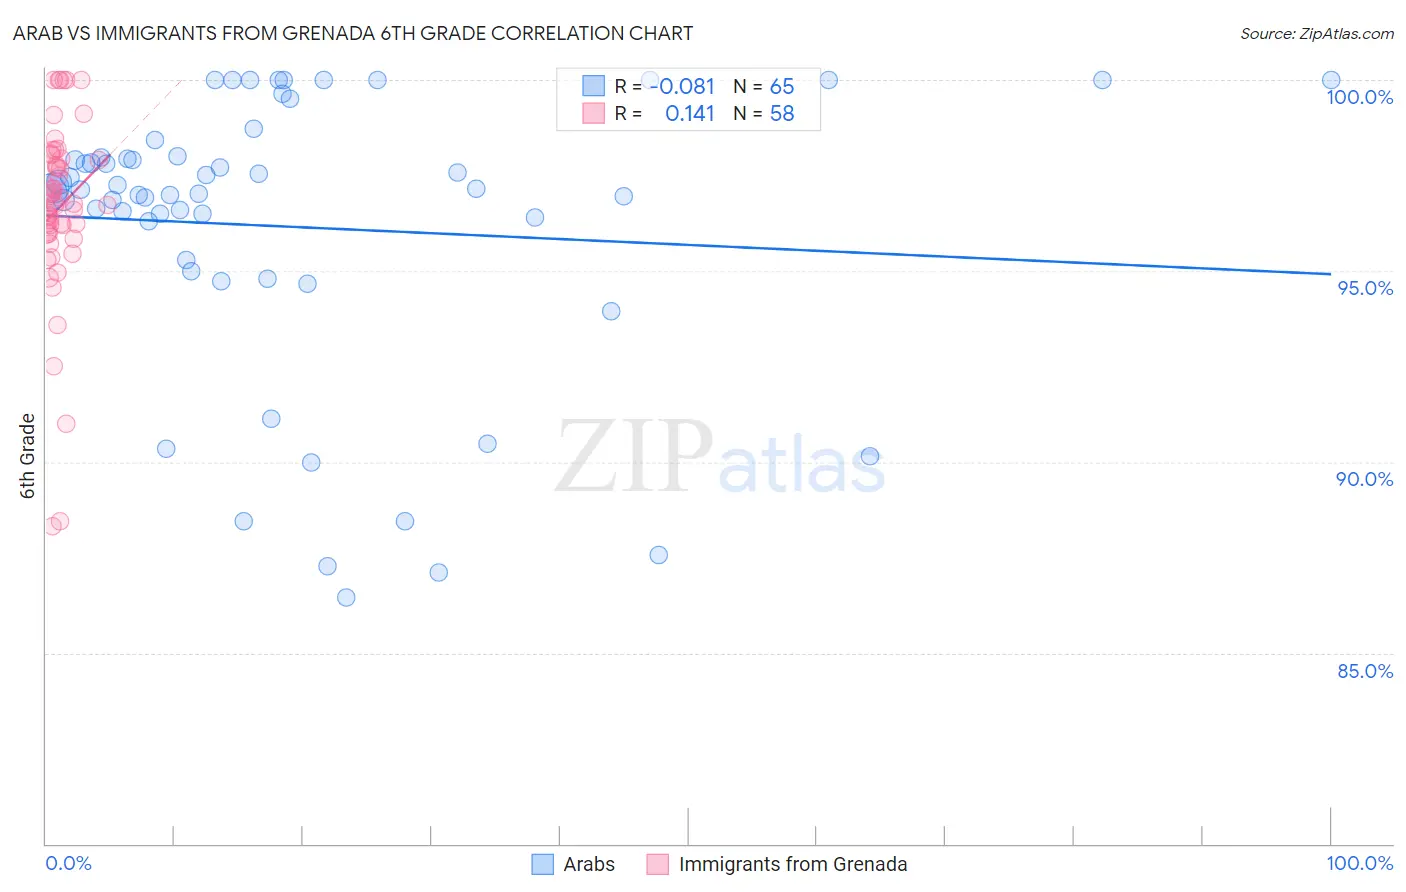
Arab vs Immigrants from Grenada 6th Grade Correlation Chart
The statistical analysis conducted on geographies consisting of 486,871,007 people shows a slight negative correlation between the proportion of Arabs and percentage of population with at least 6th grade education in the United States with a correlation coefficient (R) of -0.081 and weighted average of 97.0%. Similarly, the statistical analysis conducted on geographies consisting of 67,201,142 people shows a poor positive correlation between the proportion of Immigrants from Grenada and percentage of population with at least 6th grade education in the United States with a correlation coefficient (R) of 0.141 and weighted average of 95.9%, a difference of 1.2%.
6th Grade Correlation Summary
| Measurement | Arab | Immigrants from Grenada |
| Minimum | 86.5% | 88.3% |
| Maximum | 100.0% | 100.0% |
| Range | 13.5% | 11.7% |
| Mean | 96.2% | 96.6% |
| Median | 97.1% | 96.8% |
| Interquartile 25% (IQ1) | 95.1% | 96.0% |
| Interquartile 75% (IQ3) | 98.0% | 97.9% |
| Interquartile Range (IQR) | 2.8% | 2.0% |
| Standard Deviation (Sample) | 3.7% | 2.4% |
| Standard Deviation (Population) | 3.7% | 2.3% |
Similar Demographics by 6th Grade
Demographics Similar to Arabs by 6th Grade
In terms of 6th grade, the demographic groups most similar to Arabs are Egyptian (97.1%, a difference of 0.0%), Venezuelan (97.0%, a difference of 0.0%), Bermudan (97.1%, a difference of 0.010%), Chilean (97.1%, a difference of 0.010%), and Immigrants from Sri Lanka (97.1%, a difference of 0.010%).
| Demographics | Rating | Rank | 6th Grade |
| Immigrants | Italy | 53.8 /100 | #166 | Average 97.1% |
| Apache | 53.6 /100 | #167 | Average 97.1% |
| Immigrants | Taiwan | 53.5 /100 | #168 | Average 97.1% |
| Bermudans | 52.6 /100 | #169 | Average 97.1% |
| Chileans | 52.1 /100 | #170 | Average 97.1% |
| Immigrants | Sri Lanka | 51.7 /100 | #171 | Average 97.1% |
| Egyptians | 50.9 /100 | #172 | Average 97.1% |
| Arabs | 50.1 /100 | #173 | Average 97.0% |
| Venezuelans | 50.0 /100 | #174 | Average 97.0% |
| Immigrants | Kazakhstan | 47.3 /100 | #175 | Average 97.0% |
| Immigrants | Micronesia | 47.1 /100 | #176 | Average 97.0% |
| Mongolians | 46.7 /100 | #177 | Average 97.0% |
| Pakistanis | 46.0 /100 | #178 | Average 97.0% |
| Immigrants | Kenya | 45.3 /100 | #179 | Average 97.0% |
| Immigrants | Spain | 39.9 /100 | #180 | Fair 97.0% |
Demographics Similar to Immigrants from Grenada by 6th Grade
In terms of 6th grade, the demographic groups most similar to Immigrants from Grenada are Immigrants from South Eastern Asia (95.9%, a difference of 0.010%), British West Indian (96.0%, a difference of 0.070%), Haitian (95.8%, a difference of 0.12%), Immigrants from West Indies (96.1%, a difference of 0.13%), and Immigrants from Barbados (96.1%, a difference of 0.17%).
| Demographics | Rating | Rank | 6th Grade |
| Malaysians | 0.0 /100 | #288 | Tragic 96.2% |
| Immigrants | Eritrea | 0.0 /100 | #289 | Tragic 96.1% |
| Immigrants | Somalia | 0.0 /100 | #290 | Tragic 96.1% |
| Immigrants | St. Vincent and the Grenadines | 0.0 /100 | #291 | Tragic 96.1% |
| Immigrants | Barbados | 0.0 /100 | #292 | Tragic 96.1% |
| Immigrants | West Indies | 0.0 /100 | #293 | Tragic 96.1% |
| British West Indians | 0.0 /100 | #294 | Tragic 96.0% |
| Immigrants | Grenada | 0.0 /100 | #295 | Tragic 95.9% |
| Immigrants | South Eastern Asia | 0.0 /100 | #296 | Tragic 95.9% |
| Haitians | 0.0 /100 | #297 | Tragic 95.8% |
| Sri Lankans | 0.0 /100 | #298 | Tragic 95.8% |
| Immigrants | Laos | 0.0 /100 | #299 | Tragic 95.7% |
| Immigrants | Dominica | 0.0 /100 | #300 | Tragic 95.7% |
| Immigrants | Immigrants | 0.0 /100 | #301 | Tragic 95.7% |
| Immigrants | Burma/Myanmar | 0.0 /100 | #302 | Tragic 95.7% |