Jamaican vs Immigrants from Grenada 6th Grade
COMPARE
Jamaican
Immigrants from Grenada
6th Grade
6th Grade Comparison
Jamaicans
Immigrants from Grenada
96.5%
6TH GRADE
0.6/ 100
METRIC RATING
253rd/ 347
METRIC RANK
95.9%
6TH GRADE
0.0/ 100
METRIC RATING
295th/ 347
METRIC RANK
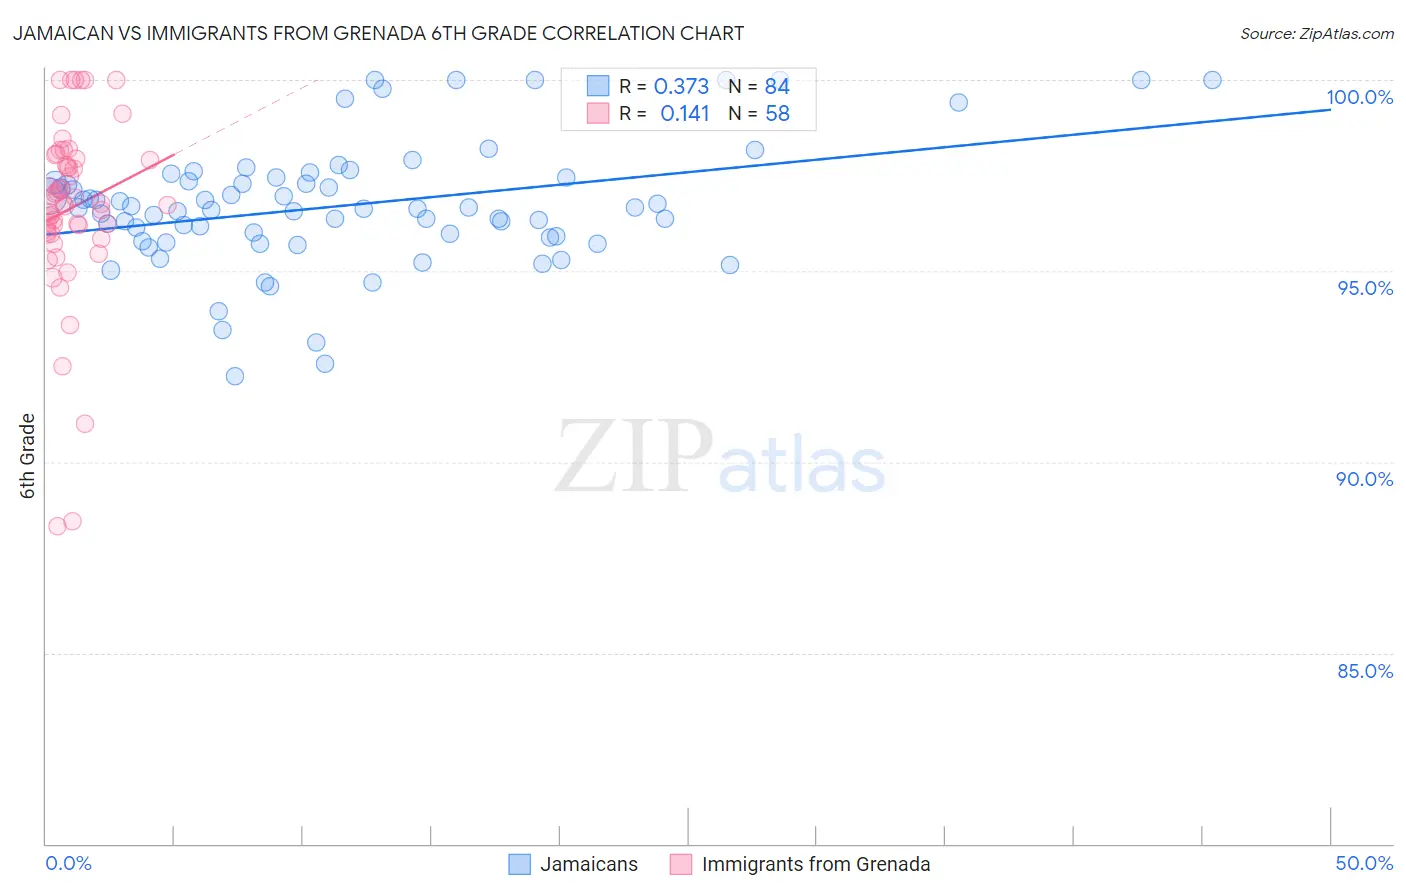
Jamaican vs Immigrants from Grenada 6th Grade Correlation Chart
The statistical analysis conducted on geographies consisting of 368,084,189 people shows a mild positive correlation between the proportion of Jamaicans and percentage of population with at least 6th grade education in the United States with a correlation coefficient (R) of 0.373 and weighted average of 96.5%. Similarly, the statistical analysis conducted on geographies consisting of 67,201,142 people shows a poor positive correlation between the proportion of Immigrants from Grenada and percentage of population with at least 6th grade education in the United States with a correlation coefficient (R) of 0.141 and weighted average of 95.9%, a difference of 0.57%.
6th Grade Correlation Summary
| Measurement | Jamaican | Immigrants from Grenada |
| Minimum | 92.2% | 88.3% |
| Maximum | 100.0% | 100.0% |
| Range | 7.8% | 11.7% |
| Mean | 96.7% | 96.6% |
| Median | 96.6% | 96.8% |
| Interquartile 25% (IQ1) | 95.9% | 96.0% |
| Interquartile 75% (IQ3) | 97.4% | 97.9% |
| Interquartile Range (IQR) | 1.5% | 2.0% |
| Standard Deviation (Sample) | 1.6% | 2.4% |
| Standard Deviation (Population) | 1.6% | 2.3% |
Similar Demographics by 6th Grade
Demographics Similar to Jamaicans by 6th Grade
In terms of 6th grade, the demographic groups most similar to Jamaicans are Immigrants from Ethiopia (96.5%, a difference of 0.0%), Immigrants from Senegal (96.5%, a difference of 0.010%), Immigrants from Uruguay (96.5%, a difference of 0.010%), Immigrants from Congo (96.5%, a difference of 0.010%), and U.S. Virgin Islander (96.5%, a difference of 0.010%).
| Demographics | Rating | Rank | 6th Grade |
| Immigrants | Africa | 1.3 /100 | #246 | Tragic 96.6% |
| Bolivians | 1.0 /100 | #247 | Tragic 96.5% |
| Tohono O'odham | 1.0 /100 | #248 | Tragic 96.5% |
| Colombians | 0.9 /100 | #249 | Tragic 96.5% |
| Immigrants | Middle Africa | 0.8 /100 | #250 | Tragic 96.5% |
| Immigrants | Senegal | 0.7 /100 | #251 | Tragic 96.5% |
| Immigrants | Uruguay | 0.6 /100 | #252 | Tragic 96.5% |
| Jamaicans | 0.6 /100 | #253 | Tragic 96.5% |
| Immigrants | Ethiopia | 0.6 /100 | #254 | Tragic 96.5% |
| Immigrants | Congo | 0.6 /100 | #255 | Tragic 96.5% |
| U.S. Virgin Islanders | 0.5 /100 | #256 | Tragic 96.5% |
| Taiwanese | 0.5 /100 | #257 | Tragic 96.5% |
| Immigrants | China | 0.4 /100 | #258 | Tragic 96.4% |
| South Americans | 0.4 /100 | #259 | Tragic 96.4% |
| Peruvians | 0.4 /100 | #260 | Tragic 96.4% |
Demographics Similar to Immigrants from Grenada by 6th Grade
In terms of 6th grade, the demographic groups most similar to Immigrants from Grenada are Immigrants from South Eastern Asia (95.9%, a difference of 0.010%), British West Indian (96.0%, a difference of 0.070%), Haitian (95.8%, a difference of 0.12%), Immigrants from West Indies (96.1%, a difference of 0.13%), and Immigrants from Barbados (96.1%, a difference of 0.17%).
| Demographics | Rating | Rank | 6th Grade |
| Malaysians | 0.0 /100 | #288 | Tragic 96.2% |
| Immigrants | Eritrea | 0.0 /100 | #289 | Tragic 96.1% |
| Immigrants | Somalia | 0.0 /100 | #290 | Tragic 96.1% |
| Immigrants | St. Vincent and the Grenadines | 0.0 /100 | #291 | Tragic 96.1% |
| Immigrants | Barbados | 0.0 /100 | #292 | Tragic 96.1% |
| Immigrants | West Indies | 0.0 /100 | #293 | Tragic 96.1% |
| British West Indians | 0.0 /100 | #294 | Tragic 96.0% |
| Immigrants | Grenada | 0.0 /100 | #295 | Tragic 95.9% |
| Immigrants | South Eastern Asia | 0.0 /100 | #296 | Tragic 95.9% |
| Haitians | 0.0 /100 | #297 | Tragic 95.8% |
| Sri Lankans | 0.0 /100 | #298 | Tragic 95.8% |
| Immigrants | Laos | 0.0 /100 | #299 | Tragic 95.7% |
| Immigrants | Dominica | 0.0 /100 | #300 | Tragic 95.7% |
| Immigrants | Immigrants | 0.0 /100 | #301 | Tragic 95.7% |
| Immigrants | Burma/Myanmar | 0.0 /100 | #302 | Tragic 95.7% |