Assyrian/Chaldean/Syriac vs Immigrants from Grenada 6th Grade
COMPARE
Assyrian/Chaldean/Syriac
Immigrants from Grenada
6th Grade
6th Grade Comparison
Assyrians/Chaldeans/Syriacs
Immigrants from Grenada
96.7%
6TH GRADE
4.0/ 100
METRIC RATING
229th/ 347
METRIC RANK
95.9%
6TH GRADE
0.0/ 100
METRIC RATING
295th/ 347
METRIC RANK
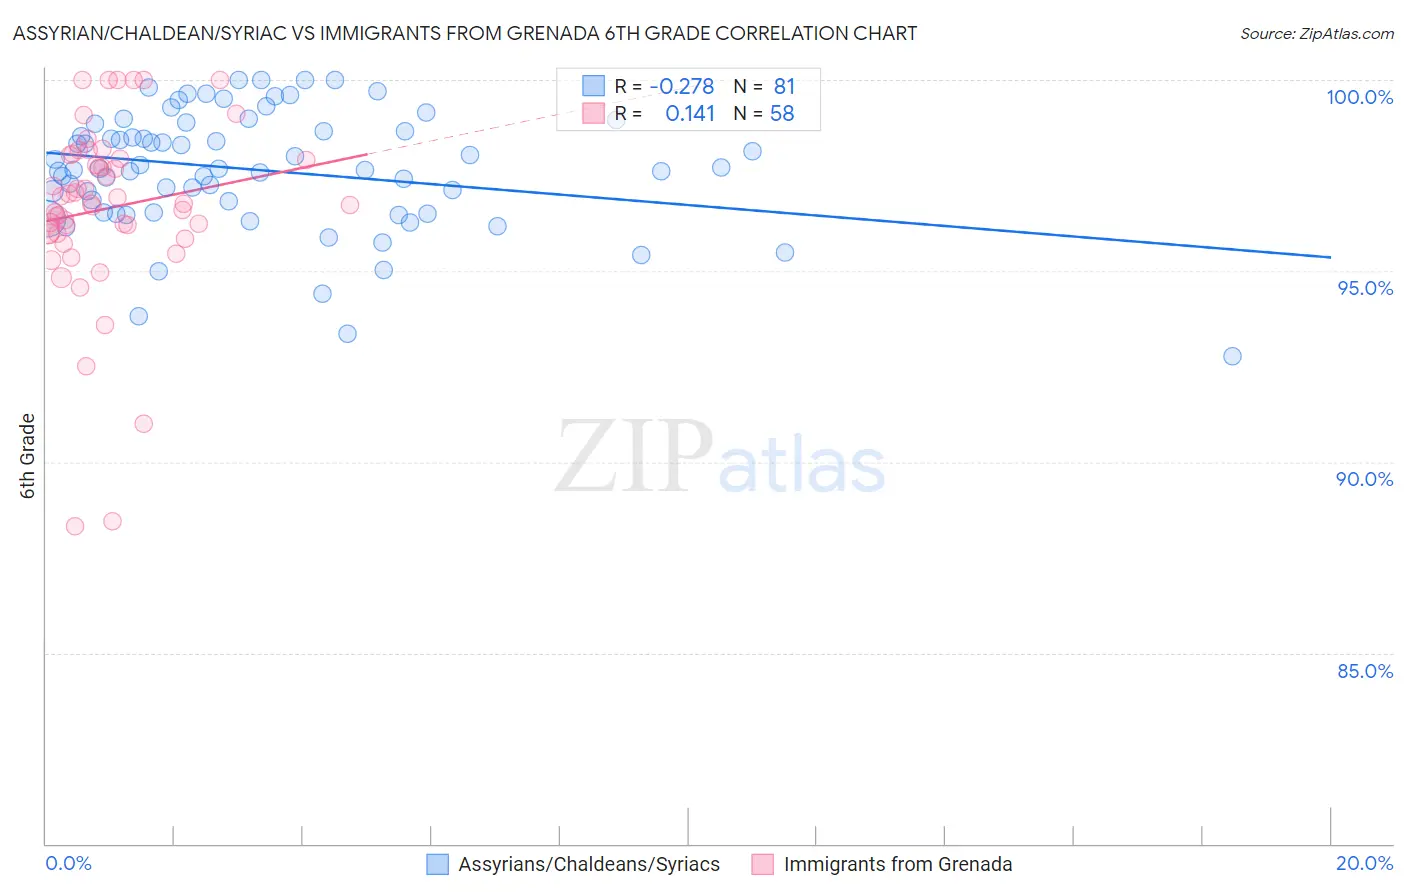
Assyrian/Chaldean/Syriac vs Immigrants from Grenada 6th Grade Correlation Chart
The statistical analysis conducted on geographies consisting of 110,318,304 people shows a weak negative correlation between the proportion of Assyrians/Chaldeans/Syriacs and percentage of population with at least 6th grade education in the United States with a correlation coefficient (R) of -0.278 and weighted average of 96.7%. Similarly, the statistical analysis conducted on geographies consisting of 67,201,142 people shows a poor positive correlation between the proportion of Immigrants from Grenada and percentage of population with at least 6th grade education in the United States with a correlation coefficient (R) of 0.141 and weighted average of 95.9%, a difference of 0.79%.
6th Grade Correlation Summary
| Measurement | Assyrian/Chaldean/Syriac | Immigrants from Grenada |
| Minimum | 92.8% | 88.3% |
| Maximum | 100.0% | 100.0% |
| Range | 7.2% | 11.7% |
| Mean | 97.6% | 96.6% |
| Median | 97.7% | 96.8% |
| Interquartile 25% (IQ1) | 96.5% | 96.0% |
| Interquartile 75% (IQ3) | 98.8% | 97.9% |
| Interquartile Range (IQR) | 2.2% | 2.0% |
| Standard Deviation (Sample) | 1.6% | 2.4% |
| Standard Deviation (Population) | 1.6% | 2.3% |
Similar Demographics by 6th Grade
Demographics Similar to Assyrians/Chaldeans/Syriacs by 6th Grade
In terms of 6th grade, the demographic groups most similar to Assyrians/Chaldeans/Syriacs are Immigrants from Western Asia (96.7%, a difference of 0.0%), Immigrants from Malaysia (96.7%, a difference of 0.0%), Immigrants from Eastern Asia (96.7%, a difference of 0.0%), Immigrants from Southern Europe (96.7%, a difference of 0.010%), and Immigrants from Pakistan (96.7%, a difference of 0.010%).
| Demographics | Rating | Rank | 6th Grade |
| Immigrants | Syria | 5.9 /100 | #222 | Tragic 96.7% |
| Bahamians | 4.8 /100 | #223 | Tragic 96.7% |
| Immigrants | Southern Europe | 4.4 /100 | #224 | Tragic 96.7% |
| Immigrants | Pakistan | 4.4 /100 | #225 | Tragic 96.7% |
| Immigrants | Panama | 4.2 /100 | #226 | Tragic 96.7% |
| Immigrants | Western Asia | 4.1 /100 | #227 | Tragic 96.7% |
| Immigrants | Malaysia | 4.0 /100 | #228 | Tragic 96.7% |
| Assyrians/Chaldeans/Syriacs | 4.0 /100 | #229 | Tragic 96.7% |
| Immigrants | Eastern Asia | 4.0 /100 | #230 | Tragic 96.7% |
| Sub-Saharan Africans | 3.5 /100 | #231 | Tragic 96.7% |
| South American Indians | 3.5 /100 | #232 | Tragic 96.7% |
| Yuman | 3.2 /100 | #233 | Tragic 96.7% |
| Uruguayans | 2.5 /100 | #234 | Tragic 96.6% |
| Asians | 2.4 /100 | #235 | Tragic 96.6% |
| Immigrants | Indonesia | 2.3 /100 | #236 | Tragic 96.6% |
Demographics Similar to Immigrants from Grenada by 6th Grade
In terms of 6th grade, the demographic groups most similar to Immigrants from Grenada are Immigrants from South Eastern Asia (95.9%, a difference of 0.010%), British West Indian (96.0%, a difference of 0.070%), Haitian (95.8%, a difference of 0.12%), Immigrants from West Indies (96.1%, a difference of 0.13%), and Immigrants from Barbados (96.1%, a difference of 0.17%).
| Demographics | Rating | Rank | 6th Grade |
| Malaysians | 0.0 /100 | #288 | Tragic 96.2% |
| Immigrants | Eritrea | 0.0 /100 | #289 | Tragic 96.1% |
| Immigrants | Somalia | 0.0 /100 | #290 | Tragic 96.1% |
| Immigrants | St. Vincent and the Grenadines | 0.0 /100 | #291 | Tragic 96.1% |
| Immigrants | Barbados | 0.0 /100 | #292 | Tragic 96.1% |
| Immigrants | West Indies | 0.0 /100 | #293 | Tragic 96.1% |
| British West Indians | 0.0 /100 | #294 | Tragic 96.0% |
| Immigrants | Grenada | 0.0 /100 | #295 | Tragic 95.9% |
| Immigrants | South Eastern Asia | 0.0 /100 | #296 | Tragic 95.9% |
| Haitians | 0.0 /100 | #297 | Tragic 95.8% |
| Sri Lankans | 0.0 /100 | #298 | Tragic 95.8% |
| Immigrants | Laos | 0.0 /100 | #299 | Tragic 95.7% |
| Immigrants | Dominica | 0.0 /100 | #300 | Tragic 95.7% |
| Immigrants | Immigrants | 0.0 /100 | #301 | Tragic 95.7% |
| Immigrants | Burma/Myanmar | 0.0 /100 | #302 | Tragic 95.7% |