Immigrants from Bangladesh vs Immigrants from Grenada 6th Grade
COMPARE
Immigrants from Bangladesh
Immigrants from Grenada
6th Grade
6th Grade Comparison
Immigrants from Bangladesh
Immigrants from Grenada
95.4%
6TH GRADE
0.0/ 100
METRIC RATING
315th/ 347
METRIC RANK
95.9%
6TH GRADE
0.0/ 100
METRIC RATING
295th/ 347
METRIC RANK
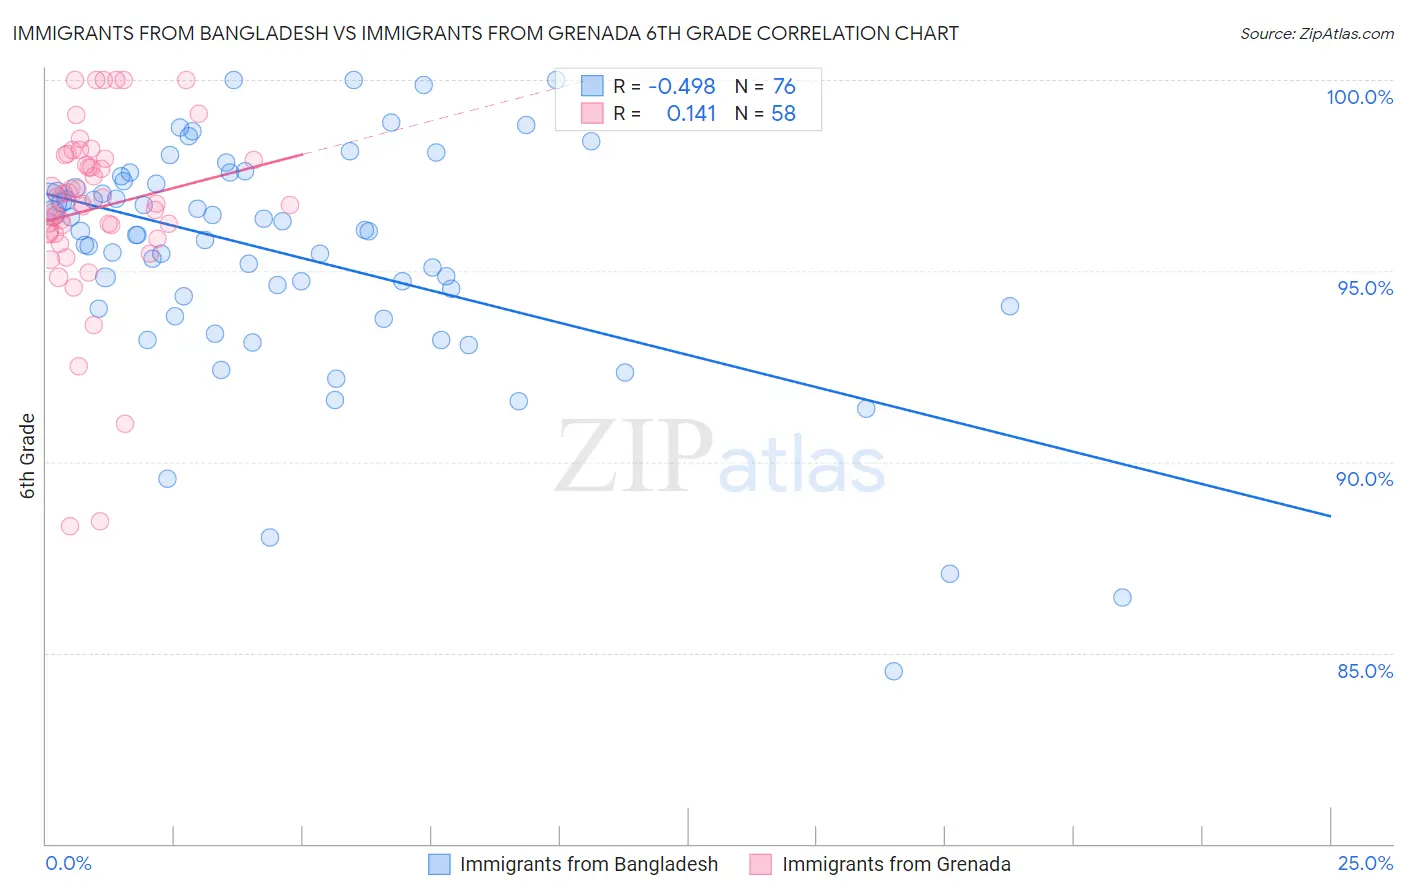
Immigrants from Bangladesh vs Immigrants from Grenada 6th Grade Correlation Chart
The statistical analysis conducted on geographies consisting of 203,672,706 people shows a moderate negative correlation between the proportion of Immigrants from Bangladesh and percentage of population with at least 6th grade education in the United States with a correlation coefficient (R) of -0.498 and weighted average of 95.4%. Similarly, the statistical analysis conducted on geographies consisting of 67,201,142 people shows a poor positive correlation between the proportion of Immigrants from Grenada and percentage of population with at least 6th grade education in the United States with a correlation coefficient (R) of 0.141 and weighted average of 95.9%, a difference of 0.60%.
6th Grade Correlation Summary
| Measurement | Immigrants from Bangladesh | Immigrants from Grenada |
| Minimum | 84.5% | 88.3% |
| Maximum | 100.0% | 100.0% |
| Range | 15.5% | 11.7% |
| Mean | 95.4% | 96.6% |
| Median | 96.0% | 96.8% |
| Interquartile 25% (IQ1) | 94.0% | 96.0% |
| Interquartile 75% (IQ3) | 97.3% | 97.9% |
| Interquartile Range (IQR) | 3.3% | 2.0% |
| Standard Deviation (Sample) | 3.1% | 2.4% |
| Standard Deviation (Population) | 3.0% | 2.3% |
Demographics Similar to Immigrants from Bangladesh and Immigrants from Grenada by 6th Grade
In terms of 6th grade, the demographic groups most similar to Immigrants from Bangladesh are Immigrants from Vietnam (95.4%, a difference of 0.010%), Nicaraguan (95.4%, a difference of 0.020%), Immigrants from Guyana (95.5%, a difference of 0.10%), Immigrants from Portugal (95.5%, a difference of 0.11%), and Puerto Rican (95.5%, a difference of 0.14%). Similarly, the demographic groups most similar to Immigrants from Grenada are Immigrants from South Eastern Asia (95.9%, a difference of 0.010%), Haitian (95.8%, a difference of 0.12%), Sri Lankan (95.8%, a difference of 0.19%), Immigrants from Laos (95.7%, a difference of 0.20%), and Immigrants from Dominica (95.7%, a difference of 0.21%).
| Demographics | Rating | Rank | 6th Grade |
| Immigrants | Grenada | 0.0 /100 | #295 | Tragic 95.9% |
| Immigrants | South Eastern Asia | 0.0 /100 | #296 | Tragic 95.9% |
| Haitians | 0.0 /100 | #297 | Tragic 95.8% |
| Sri Lankans | 0.0 /100 | #298 | Tragic 95.8% |
| Immigrants | Laos | 0.0 /100 | #299 | Tragic 95.7% |
| Immigrants | Dominica | 0.0 /100 | #300 | Tragic 95.7% |
| Immigrants | Immigrants | 0.0 /100 | #301 | Tragic 95.7% |
| Immigrants | Burma/Myanmar | 0.0 /100 | #302 | Tragic 95.7% |
| Bangladeshis | 0.0 /100 | #303 | Tragic 95.7% |
| Indonesians | 0.0 /100 | #304 | Tragic 95.6% |
| Immigrants | Cuba | 0.0 /100 | #305 | Tragic 95.6% |
| Immigrants | Haiti | 0.0 /100 | #306 | Tragic 95.6% |
| Guyanese | 0.0 /100 | #307 | Tragic 95.6% |
| Immigrants | Caribbean | 0.0 /100 | #308 | Tragic 95.6% |
| Puerto Ricans | 0.0 /100 | #309 | Tragic 95.5% |
| Ecuadorians | 0.0 /100 | #310 | Tragic 95.5% |
| Immigrants | Portugal | 0.0 /100 | #311 | Tragic 95.5% |
| Immigrants | Guyana | 0.0 /100 | #312 | Tragic 95.5% |
| Nicaraguans | 0.0 /100 | #313 | Tragic 95.4% |
| Immigrants | Vietnam | 0.0 /100 | #314 | Tragic 95.4% |
| Immigrants | Bangladesh | 0.0 /100 | #315 | Tragic 95.4% |