Hawaiian vs Immigrants from Barbados 4th Grade
COMPARE
Hawaiian
Immigrants from Barbados
4th Grade
4th Grade Comparison
Hawaiians
Immigrants from Barbados
97.4%
4TH GRADE
25.6/ 100
METRIC RATING
197th/ 347
METRIC RANK
96.8%
4TH GRADE
0.0/ 100
METRIC RATING
285th/ 347
METRIC RANK
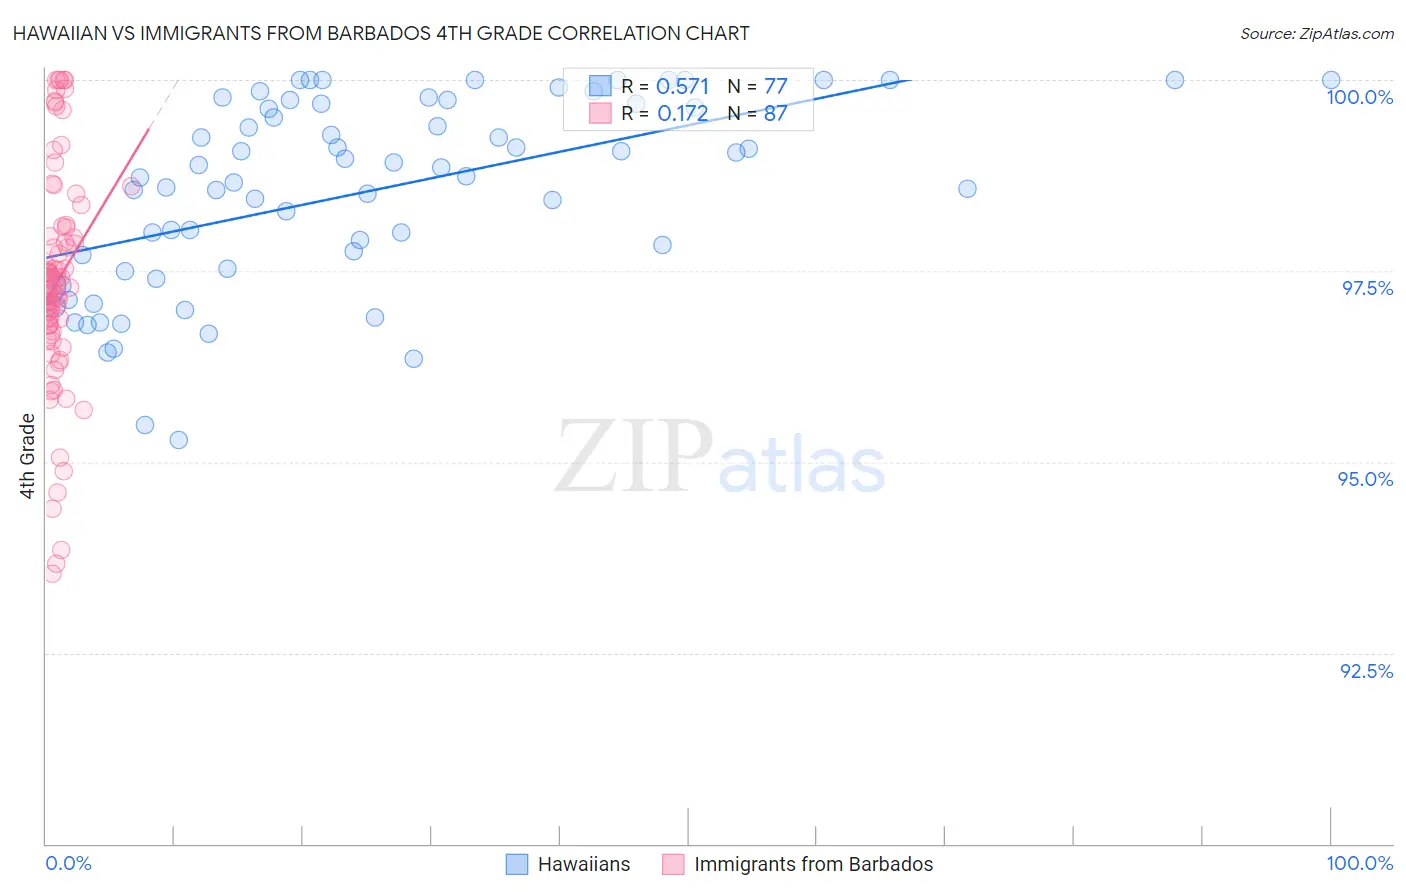
Hawaiian vs Immigrants from Barbados 4th Grade Correlation Chart
The statistical analysis conducted on geographies consisting of 327,621,279 people shows a substantial positive correlation between the proportion of Hawaiians and percentage of population with at least 4th grade education in the United States with a correlation coefficient (R) of 0.571 and weighted average of 97.4%. Similarly, the statistical analysis conducted on geographies consisting of 112,788,359 people shows a poor positive correlation between the proportion of Immigrants from Barbados and percentage of population with at least 4th grade education in the United States with a correlation coefficient (R) of 0.172 and weighted average of 96.8%, a difference of 0.64%.
4th Grade Correlation Summary
| Measurement | Hawaiian | Immigrants from Barbados |
| Minimum | 95.3% | 93.5% |
| Maximum | 100.0% | 100.0% |
| Range | 4.7% | 6.5% |
| Mean | 98.5% | 97.4% |
| Median | 98.7% | 97.3% |
| Interquartile 25% (IQ1) | 97.5% | 96.7% |
| Interquartile 75% (IQ3) | 99.7% | 98.1% |
| Interquartile Range (IQR) | 2.2% | 1.4% |
| Standard Deviation (Sample) | 1.2% | 1.4% |
| Standard Deviation (Population) | 1.2% | 1.4% |
Similar Demographics by 4th Grade
Demographics Similar to Hawaiians by 4th Grade
In terms of 4th grade, the demographic groups most similar to Hawaiians are Immigrants from Albania (97.4%, a difference of 0.010%), Guamanian/Chamorro (97.4%, a difference of 0.010%), Navajo (97.4%, a difference of 0.020%), Immigrants from Ukraine (97.4%, a difference of 0.020%), and Immigrants from Egypt (97.4%, a difference of 0.020%).
| Demographics | Rating | Rank | 4th Grade |
| Blacks/African Americans | 31.1 /100 | #190 | Fair 97.4% |
| Navajo | 30.7 /100 | #191 | Fair 97.4% |
| Immigrants | Ukraine | 30.1 /100 | #192 | Fair 97.4% |
| Immigrants | Egypt | 30.1 /100 | #193 | Fair 97.4% |
| Portuguese | 29.2 /100 | #194 | Fair 97.4% |
| Paraguayans | 28.9 /100 | #195 | Fair 97.4% |
| Immigrants | Albania | 27.7 /100 | #196 | Fair 97.4% |
| Hawaiians | 25.6 /100 | #197 | Fair 97.4% |
| Guamanians/Chamorros | 23.0 /100 | #198 | Fair 97.4% |
| Natives/Alaskans | 20.6 /100 | #199 | Fair 97.4% |
| Immigrants | Uganda | 19.8 /100 | #200 | Poor 97.4% |
| Immigrants | Southern Europe | 16.2 /100 | #201 | Poor 97.4% |
| Immigrants | Chile | 16.1 /100 | #202 | Poor 97.4% |
| Immigrants | Northern Africa | 15.1 /100 | #203 | Poor 97.4% |
| Africans | 14.6 /100 | #204 | Poor 97.4% |
Demographics Similar to Immigrants from Barbados by 4th Grade
In terms of 4th grade, the demographic groups most similar to Immigrants from Barbados are Immigrants from Thailand (96.8%, a difference of 0.0%), Immigrants from St. Vincent and the Grenadines (96.8%, a difference of 0.020%), Immigrants from Philippines (96.8%, a difference of 0.040%), Houma (96.8%, a difference of 0.040%), and Immigrants from Afghanistan (96.8%, a difference of 0.040%).
| Demographics | Rating | Rank | 4th Grade |
| Immigrants | Bolivia | 0.1 /100 | #278 | Tragic 96.9% |
| Afghans | 0.1 /100 | #279 | Tragic 96.9% |
| Barbadians | 0.1 /100 | #280 | Tragic 96.9% |
| Immigrants | Hong Kong | 0.1 /100 | #281 | Tragic 96.9% |
| Immigrants | Trinidad and Tobago | 0.1 /100 | #282 | Tragic 96.8% |
| Immigrants | Philippines | 0.1 /100 | #283 | Tragic 96.8% |
| Immigrants | St. Vincent and the Grenadines | 0.1 /100 | #284 | Tragic 96.8% |
| Immigrants | Barbados | 0.0 /100 | #285 | Tragic 96.8% |
| Immigrants | Thailand | 0.0 /100 | #286 | Tragic 96.8% |
| Houma | 0.0 /100 | #287 | Tragic 96.8% |
| Immigrants | Afghanistan | 0.0 /100 | #288 | Tragic 96.8% |
| Immigrants | West Indies | 0.0 /100 | #289 | Tragic 96.7% |
| British West Indians | 0.0 /100 | #290 | Tragic 96.7% |
| Immigrants | Grenada | 0.0 /100 | #291 | Tragic 96.7% |
| Malaysians | 0.0 /100 | #292 | Tragic 96.7% |