Hawaiian vs Jordanian 4th Grade
COMPARE
Hawaiian
Jordanian
4th Grade
4th Grade Comparison
Hawaiians
Jordanians
97.4%
4TH GRADE
25.6/ 100
METRIC RATING
197th/ 347
METRIC RANK
97.7%
4TH GRADE
81.3/ 100
METRIC RATING
146th/ 347
METRIC RANK
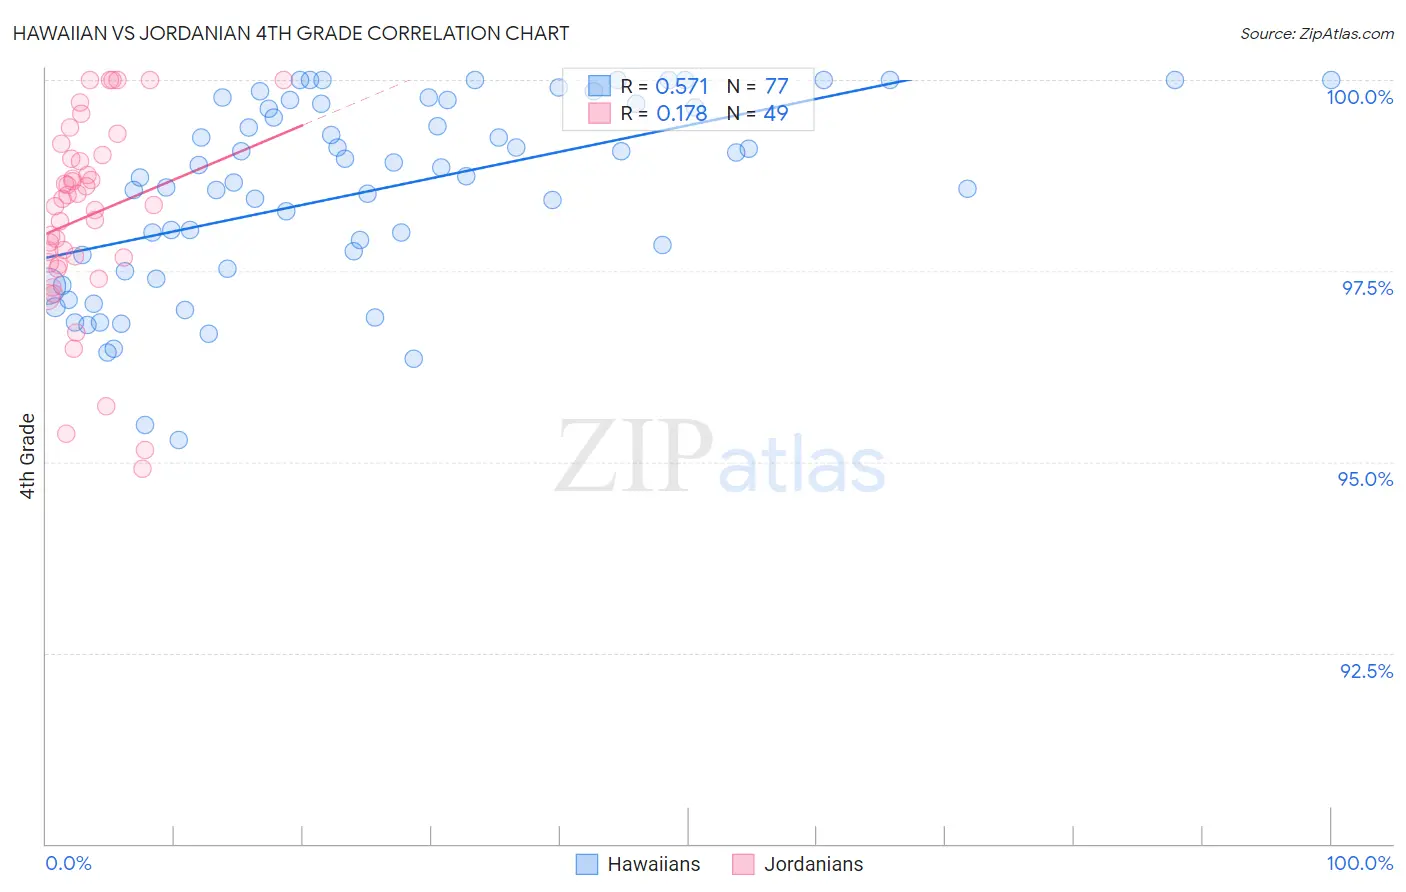
Hawaiian vs Jordanian 4th Grade Correlation Chart
The statistical analysis conducted on geographies consisting of 327,621,279 people shows a substantial positive correlation between the proportion of Hawaiians and percentage of population with at least 4th grade education in the United States with a correlation coefficient (R) of 0.571 and weighted average of 97.4%. Similarly, the statistical analysis conducted on geographies consisting of 166,424,117 people shows a poor positive correlation between the proportion of Jordanians and percentage of population with at least 4th grade education in the United States with a correlation coefficient (R) of 0.178 and weighted average of 97.7%, a difference of 0.24%.
4th Grade Correlation Summary
| Measurement | Hawaiian | Jordanian |
| Minimum | 95.3% | 94.9% |
| Maximum | 100.0% | 100.0% |
| Range | 4.7% | 5.1% |
| Mean | 98.5% | 98.2% |
| Median | 98.7% | 98.4% |
| Interquartile 25% (IQ1) | 97.5% | 97.6% |
| Interquartile 75% (IQ3) | 99.7% | 99.0% |
| Interquartile Range (IQR) | 2.2% | 1.4% |
| Standard Deviation (Sample) | 1.2% | 1.3% |
| Standard Deviation (Population) | 1.2% | 1.2% |
Similar Demographics by 4th Grade
Demographics Similar to Hawaiians by 4th Grade
In terms of 4th grade, the demographic groups most similar to Hawaiians are Immigrants from Albania (97.4%, a difference of 0.010%), Guamanian/Chamorro (97.4%, a difference of 0.010%), Navajo (97.4%, a difference of 0.020%), Immigrants from Ukraine (97.4%, a difference of 0.020%), and Immigrants from Egypt (97.4%, a difference of 0.020%).
| Demographics | Rating | Rank | 4th Grade |
| Blacks/African Americans | 31.1 /100 | #190 | Fair 97.4% |
| Navajo | 30.7 /100 | #191 | Fair 97.4% |
| Immigrants | Ukraine | 30.1 /100 | #192 | Fair 97.4% |
| Immigrants | Egypt | 30.1 /100 | #193 | Fair 97.4% |
| Portuguese | 29.2 /100 | #194 | Fair 97.4% |
| Paraguayans | 28.9 /100 | #195 | Fair 97.4% |
| Immigrants | Albania | 27.7 /100 | #196 | Fair 97.4% |
| Hawaiians | 25.6 /100 | #197 | Fair 97.4% |
| Guamanians/Chamorros | 23.0 /100 | #198 | Fair 97.4% |
| Natives/Alaskans | 20.6 /100 | #199 | Fair 97.4% |
| Immigrants | Uganda | 19.8 /100 | #200 | Poor 97.4% |
| Immigrants | Southern Europe | 16.2 /100 | #201 | Poor 97.4% |
| Immigrants | Chile | 16.1 /100 | #202 | Poor 97.4% |
| Immigrants | Northern Africa | 15.1 /100 | #203 | Poor 97.4% |
| Africans | 14.6 /100 | #204 | Poor 97.4% |
Demographics Similar to Jordanians by 4th Grade
In terms of 4th grade, the demographic groups most similar to Jordanians are Ute (97.7%, a difference of 0.0%), Hopi (97.7%, a difference of 0.0%), Immigrants from North Macedonia (97.7%, a difference of 0.010%), Burmese (97.7%, a difference of 0.010%), and Spaniard (97.7%, a difference of 0.010%).
| Demographics | Rating | Rank | 4th Grade |
| Seminole | 84.7 /100 | #139 | Excellent 97.7% |
| Filipinos | 84.0 /100 | #140 | Excellent 97.7% |
| Immigrants | Greece | 83.8 /100 | #141 | Excellent 97.7% |
| Immigrants | North Macedonia | 83.3 /100 | #142 | Excellent 97.7% |
| Burmese | 82.8 /100 | #143 | Excellent 97.7% |
| Spaniards | 82.7 /100 | #144 | Excellent 97.7% |
| Immigrants | Moldova | 82.4 /100 | #145 | Excellent 97.7% |
| Jordanians | 81.3 /100 | #146 | Excellent 97.7% |
| Ute | 80.6 /100 | #147 | Excellent 97.7% |
| Hopi | 80.6 /100 | #148 | Excellent 97.7% |
| Soviet Union | 77.8 /100 | #149 | Good 97.6% |
| Immigrants | Israel | 77.7 /100 | #150 | Good 97.6% |
| Alsatians | 77.2 /100 | #151 | Good 97.6% |
| Immigrants | South Central Asia | 76.2 /100 | #152 | Good 97.6% |
| Immigrants | Eastern Europe | 71.3 /100 | #153 | Good 97.6% |