Hawaiian vs Immigrants from Cambodia 10th Grade
COMPARE
Hawaiian
Immigrants from Cambodia
10th Grade
10th Grade Comparison
Hawaiians
Immigrants from Cambodia
93.5%
10TH GRADE
21.8/ 100
METRIC RATING
201st/ 347
METRIC RANK
90.9%
10TH GRADE
0.0/ 100
METRIC RATING
311th/ 347
METRIC RANK
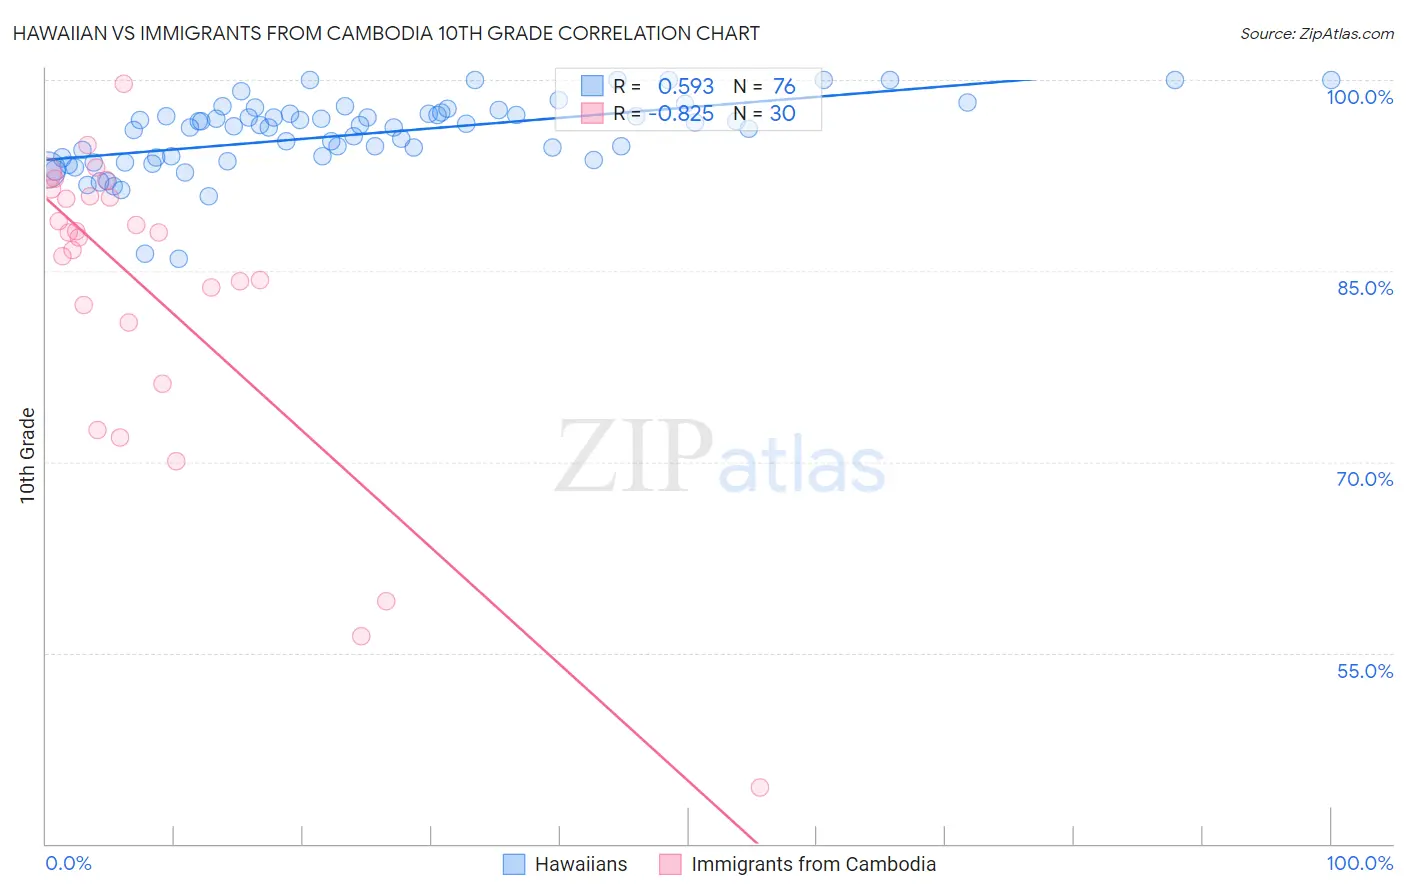
Hawaiian vs Immigrants from Cambodia 10th Grade Correlation Chart
The statistical analysis conducted on geographies consisting of 327,620,881 people shows a substantial positive correlation between the proportion of Hawaiians and percentage of population with at least 10th grade education in the United States with a correlation coefficient (R) of 0.593 and weighted average of 93.5%. Similarly, the statistical analysis conducted on geographies consisting of 205,153,442 people shows a very strong negative correlation between the proportion of Immigrants from Cambodia and percentage of population with at least 10th grade education in the United States with a correlation coefficient (R) of -0.825 and weighted average of 90.9%, a difference of 2.8%.
10th Grade Correlation Summary
| Measurement | Hawaiian | Immigrants from Cambodia |
| Minimum | 86.0% | 44.4% |
| Maximum | 100.0% | 99.7% |
| Range | 14.0% | 55.2% |
| Mean | 95.7% | 83.2% |
| Median | 96.4% | 87.8% |
| Interquartile 25% (IQ1) | 93.9% | 80.9% |
| Interquartile 75% (IQ3) | 97.4% | 90.8% |
| Interquartile Range (IQR) | 3.5% | 9.9% |
| Standard Deviation (Sample) | 2.8% | 12.4% |
| Standard Deviation (Population) | 2.8% | 12.2% |
Similar Demographics by 10th Grade
Demographics Similar to Hawaiians by 10th Grade
In terms of 10th grade, the demographic groups most similar to Hawaiians are Hopi (93.5%, a difference of 0.0%), Immigrants from Uganda (93.5%, a difference of 0.010%), Immigrants from Micronesia (93.5%, a difference of 0.020%), Asian (93.5%, a difference of 0.020%), and Immigrants from Western Asia (93.4%, a difference of 0.020%).
| Demographics | Rating | Rank | 10th Grade |
| Immigrants | Morocco | 26.9 /100 | #194 | Fair 93.5% |
| Cheyenne | 26.8 /100 | #195 | Fair 93.5% |
| Moroccans | 25.3 /100 | #196 | Fair 93.5% |
| Pueblo | 23.9 /100 | #197 | Fair 93.5% |
| Immigrants | Micronesia | 23.2 /100 | #198 | Fair 93.5% |
| Asians | 23.0 /100 | #199 | Fair 93.5% |
| Hopi | 22.2 /100 | #200 | Fair 93.5% |
| Hawaiians | 21.8 /100 | #201 | Fair 93.5% |
| Immigrants | Uganda | 20.9 /100 | #202 | Fair 93.5% |
| Immigrants | Western Asia | 20.6 /100 | #203 | Fair 93.4% |
| Ute | 20.3 /100 | #204 | Fair 93.4% |
| Immigrants | Indonesia | 20.2 /100 | #205 | Fair 93.4% |
| Immigrants | Sudan | 20.0 /100 | #206 | Fair 93.4% |
| Samoans | 19.5 /100 | #207 | Poor 93.4% |
| Immigrants | Syria | 19.4 /100 | #208 | Poor 93.4% |
Demographics Similar to Immigrants from Cambodia by 10th Grade
In terms of 10th grade, the demographic groups most similar to Immigrants from Cambodia are Vietnamese (90.9%, a difference of 0.020%), Immigrants (91.0%, a difference of 0.060%), Immigrants from Bangladesh (91.0%, a difference of 0.10%), Immigrants from Fiji (91.0%, a difference of 0.11%), and Immigrants from Portugal (90.8%, a difference of 0.16%).
| Demographics | Rating | Rank | 10th Grade |
| Pima | 0.0 /100 | #304 | Tragic 91.2% |
| Immigrants | Dominica | 0.0 /100 | #305 | Tragic 91.1% |
| Yaqui | 0.0 /100 | #306 | Tragic 91.1% |
| Immigrants | Fiji | 0.0 /100 | #307 | Tragic 91.0% |
| Immigrants | Bangladesh | 0.0 /100 | #308 | Tragic 91.0% |
| Immigrants | Immigrants | 0.0 /100 | #309 | Tragic 91.0% |
| Vietnamese | 0.0 /100 | #310 | Tragic 90.9% |
| Immigrants | Cambodia | 0.0 /100 | #311 | Tragic 90.9% |
| Immigrants | Portugal | 0.0 /100 | #312 | Tragic 90.8% |
| Cape Verdeans | 0.0 /100 | #313 | Tragic 90.8% |
| Nepalese | 0.0 /100 | #314 | Tragic 90.7% |
| Immigrants | Caribbean | 0.0 /100 | #315 | Tragic 90.6% |
| Ecuadorians | 0.0 /100 | #316 | Tragic 90.6% |
| Immigrants | Ecuador | 0.0 /100 | #317 | Tragic 90.4% |
| Immigrants | Cuba | 0.0 /100 | #318 | Tragic 90.2% |