Sioux vs Immigrants from Cambodia 10th Grade
COMPARE
Sioux
Immigrants from Cambodia
10th Grade
10th Grade Comparison
Sioux
Immigrants from Cambodia
94.4%
10TH GRADE
96.2/ 100
METRIC RATING
116th/ 347
METRIC RANK
90.9%
10TH GRADE
0.0/ 100
METRIC RATING
311th/ 347
METRIC RANK
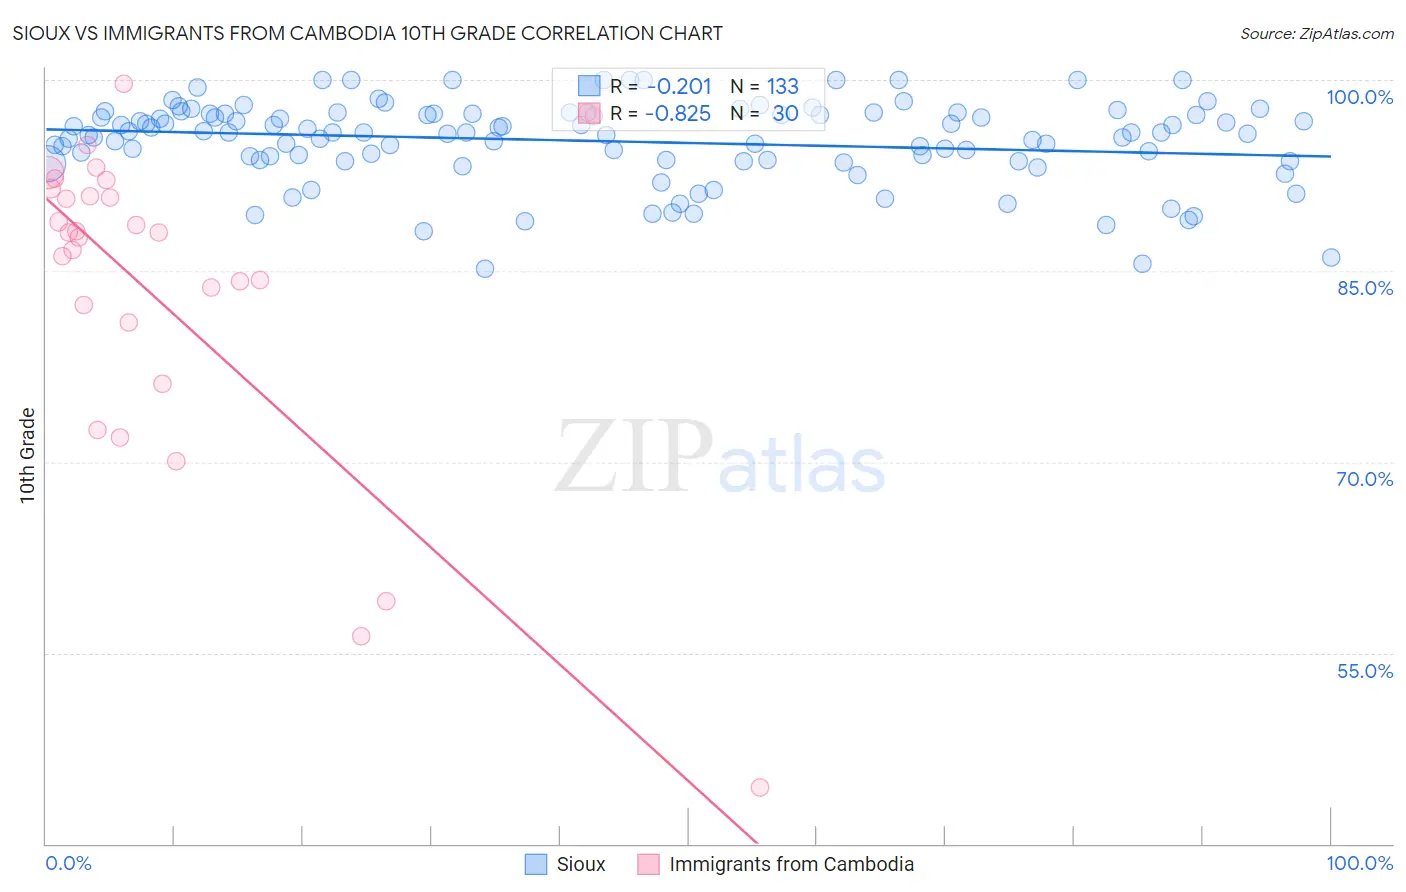
Sioux vs Immigrants from Cambodia 10th Grade Correlation Chart
The statistical analysis conducted on geographies consisting of 234,198,073 people shows a weak negative correlation between the proportion of Sioux and percentage of population with at least 10th grade education in the United States with a correlation coefficient (R) of -0.201 and weighted average of 94.4%. Similarly, the statistical analysis conducted on geographies consisting of 205,153,442 people shows a very strong negative correlation between the proportion of Immigrants from Cambodia and percentage of population with at least 10th grade education in the United States with a correlation coefficient (R) of -0.825 and weighted average of 90.9%, a difference of 3.8%.
10th Grade Correlation Summary
| Measurement | Sioux | Immigrants from Cambodia |
| Minimum | 85.2% | 44.4% |
| Maximum | 100.0% | 99.7% |
| Range | 14.8% | 55.2% |
| Mean | 95.2% | 83.2% |
| Median | 95.9% | 87.8% |
| Interquartile 25% (IQ1) | 93.7% | 80.9% |
| Interquartile 75% (IQ3) | 97.4% | 90.8% |
| Interquartile Range (IQR) | 3.6% | 9.9% |
| Standard Deviation (Sample) | 3.2% | 12.4% |
| Standard Deviation (Population) | 3.2% | 12.2% |
Similar Demographics by 10th Grade
Demographics Similar to Sioux by 10th Grade
In terms of 10th grade, the demographic groups most similar to Sioux are German Russian (94.4%, a difference of 0.0%), Delaware (94.4%, a difference of 0.0%), Palestinian (94.4%, a difference of 0.020%), Immigrants from Hungary (94.4%, a difference of 0.030%), and Immigrants from Zimbabwe (94.4%, a difference of 0.040%).
| Demographics | Rating | Rank | 10th Grade |
| Immigrants | Norway | 97.2 /100 | #109 | Exceptional 94.5% |
| Burmese | 97.1 /100 | #110 | Exceptional 94.5% |
| Immigrants | Zimbabwe | 96.8 /100 | #111 | Exceptional 94.4% |
| Immigrants | Kuwait | 96.8 /100 | #112 | Exceptional 94.4% |
| Palestinians | 96.5 /100 | #113 | Exceptional 94.4% |
| German Russians | 96.3 /100 | #114 | Exceptional 94.4% |
| Delaware | 96.3 /100 | #115 | Exceptional 94.4% |
| Sioux | 96.2 /100 | #116 | Exceptional 94.4% |
| Immigrants | Hungary | 95.8 /100 | #117 | Exceptional 94.4% |
| Jordanians | 95.6 /100 | #118 | Exceptional 94.4% |
| Immigrants | Israel | 95.4 /100 | #119 | Exceptional 94.4% |
| Immigrants | Taiwan | 95.3 /100 | #120 | Exceptional 94.4% |
| Immigrants | Belarus | 95.2 /100 | #121 | Exceptional 94.4% |
| Inupiat | 95.1 /100 | #122 | Exceptional 94.4% |
| Cree | 95.1 /100 | #123 | Exceptional 94.4% |
Demographics Similar to Immigrants from Cambodia by 10th Grade
In terms of 10th grade, the demographic groups most similar to Immigrants from Cambodia are Vietnamese (90.9%, a difference of 0.020%), Immigrants (91.0%, a difference of 0.060%), Immigrants from Bangladesh (91.0%, a difference of 0.10%), Immigrants from Fiji (91.0%, a difference of 0.11%), and Immigrants from Portugal (90.8%, a difference of 0.16%).
| Demographics | Rating | Rank | 10th Grade |
| Pima | 0.0 /100 | #304 | Tragic 91.2% |
| Immigrants | Dominica | 0.0 /100 | #305 | Tragic 91.1% |
| Yaqui | 0.0 /100 | #306 | Tragic 91.1% |
| Immigrants | Fiji | 0.0 /100 | #307 | Tragic 91.0% |
| Immigrants | Bangladesh | 0.0 /100 | #308 | Tragic 91.0% |
| Immigrants | Immigrants | 0.0 /100 | #309 | Tragic 91.0% |
| Vietnamese | 0.0 /100 | #310 | Tragic 90.9% |
| Immigrants | Cambodia | 0.0 /100 | #311 | Tragic 90.9% |
| Immigrants | Portugal | 0.0 /100 | #312 | Tragic 90.8% |
| Cape Verdeans | 0.0 /100 | #313 | Tragic 90.8% |
| Nepalese | 0.0 /100 | #314 | Tragic 90.7% |
| Immigrants | Caribbean | 0.0 /100 | #315 | Tragic 90.6% |
| Ecuadorians | 0.0 /100 | #316 | Tragic 90.6% |
| Immigrants | Ecuador | 0.0 /100 | #317 | Tragic 90.4% |
| Immigrants | Cuba | 0.0 /100 | #318 | Tragic 90.2% |