Hawaiian vs Cambodian 10th Grade
COMPARE
Hawaiian
Cambodian
10th Grade
10th Grade Comparison
Hawaiians
Cambodians
93.5%
10TH GRADE
21.8/ 100
METRIC RATING
201st/ 347
METRIC RANK
94.5%
10TH GRADE
97.6/ 100
METRIC RATING
102nd/ 347
METRIC RANK
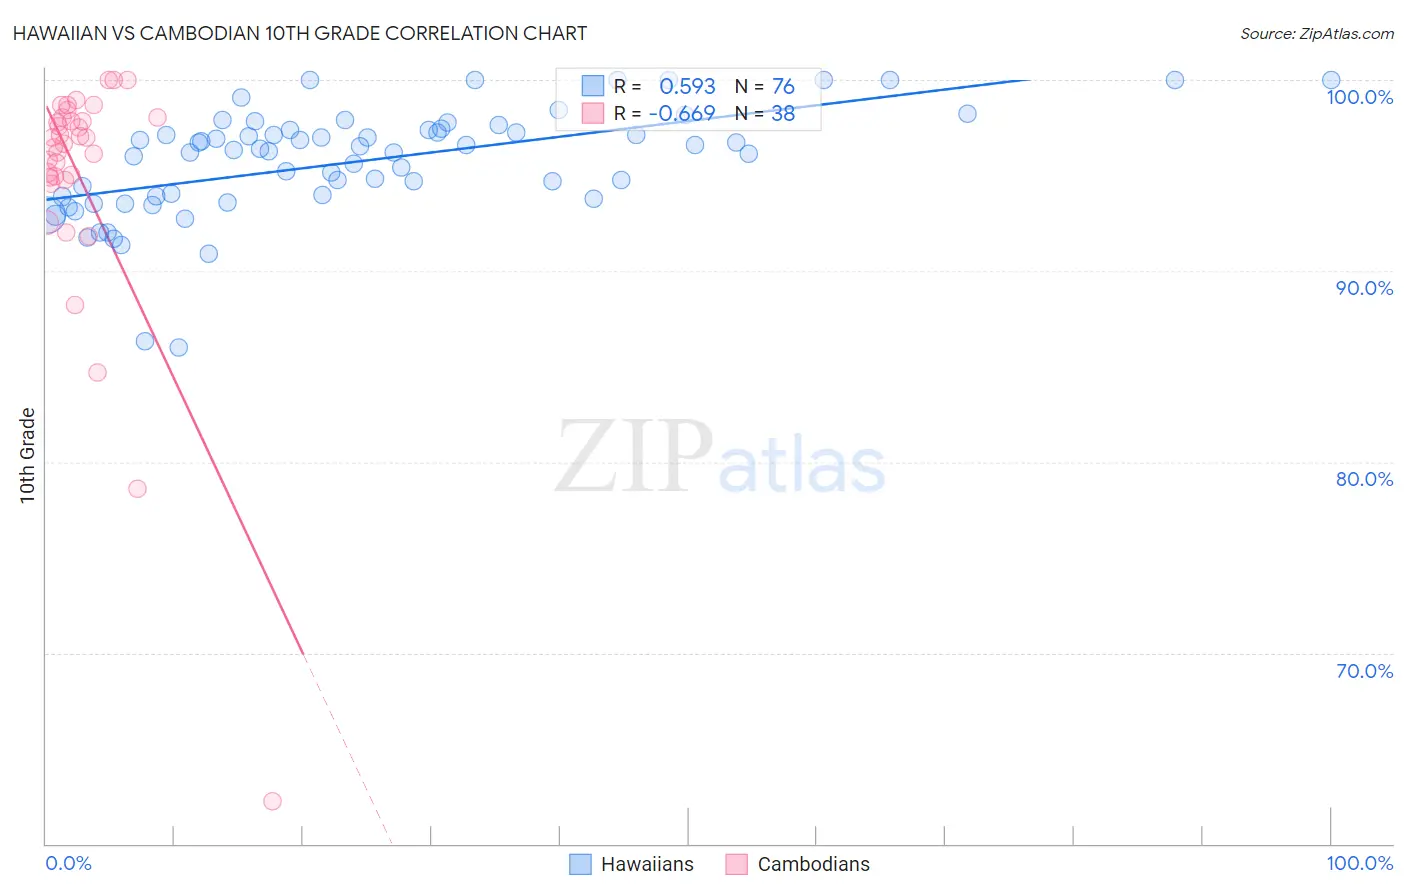
Hawaiian vs Cambodian 10th Grade Correlation Chart
The statistical analysis conducted on geographies consisting of 327,620,881 people shows a substantial positive correlation between the proportion of Hawaiians and percentage of population with at least 10th grade education in the United States with a correlation coefficient (R) of 0.593 and weighted average of 93.5%. Similarly, the statistical analysis conducted on geographies consisting of 102,514,976 people shows a significant negative correlation between the proportion of Cambodians and percentage of population with at least 10th grade education in the United States with a correlation coefficient (R) of -0.669 and weighted average of 94.5%, a difference of 1.1%.
10th Grade Correlation Summary
| Measurement | Hawaiian | Cambodian |
| Minimum | 86.0% | 62.2% |
| Maximum | 100.0% | 100.0% |
| Range | 14.0% | 37.8% |
| Mean | 95.7% | 94.8% |
| Median | 96.4% | 96.8% |
| Interquartile 25% (IQ1) | 93.9% | 94.9% |
| Interquartile 75% (IQ3) | 97.4% | 98.0% |
| Interquartile Range (IQR) | 3.5% | 3.1% |
| Standard Deviation (Sample) | 2.8% | 6.9% |
| Standard Deviation (Population) | 2.8% | 6.8% |
Similar Demographics by 10th Grade
Demographics Similar to Hawaiians by 10th Grade
In terms of 10th grade, the demographic groups most similar to Hawaiians are Hopi (93.5%, a difference of 0.0%), Immigrants from Uganda (93.5%, a difference of 0.010%), Immigrants from Micronesia (93.5%, a difference of 0.020%), Asian (93.5%, a difference of 0.020%), and Immigrants from Western Asia (93.4%, a difference of 0.020%).
| Demographics | Rating | Rank | 10th Grade |
| Immigrants | Morocco | 26.9 /100 | #194 | Fair 93.5% |
| Cheyenne | 26.8 /100 | #195 | Fair 93.5% |
| Moroccans | 25.3 /100 | #196 | Fair 93.5% |
| Pueblo | 23.9 /100 | #197 | Fair 93.5% |
| Immigrants | Micronesia | 23.2 /100 | #198 | Fair 93.5% |
| Asians | 23.0 /100 | #199 | Fair 93.5% |
| Hopi | 22.2 /100 | #200 | Fair 93.5% |
| Hawaiians | 21.8 /100 | #201 | Fair 93.5% |
| Immigrants | Uganda | 20.9 /100 | #202 | Fair 93.5% |
| Immigrants | Western Asia | 20.6 /100 | #203 | Fair 93.4% |
| Ute | 20.3 /100 | #204 | Fair 93.4% |
| Immigrants | Indonesia | 20.2 /100 | #205 | Fair 93.4% |
| Immigrants | Sudan | 20.0 /100 | #206 | Fair 93.4% |
| Samoans | 19.5 /100 | #207 | Poor 93.4% |
| Immigrants | Syria | 19.4 /100 | #208 | Poor 93.4% |
Demographics Similar to Cambodians by 10th Grade
In terms of 10th grade, the demographic groups most similar to Cambodians are Immigrants from South Central Asia (94.5%, a difference of 0.010%), Syrian (94.5%, a difference of 0.010%), Immigrants from Europe (94.5%, a difference of 0.020%), Immigrants from Romania (94.5%, a difference of 0.020%), and Immigrants from Turkey (94.5%, a difference of 0.020%).
| Demographics | Rating | Rank | 10th Grade |
| Menominee | 98.3 /100 | #95 | Exceptional 94.6% |
| Immigrants | Switzerland | 98.3 /100 | #96 | Exceptional 94.6% |
| Lebanese | 98.3 /100 | #97 | Exceptional 94.6% |
| Immigrants | Bulgaria | 98.1 /100 | #98 | Exceptional 94.6% |
| Immigrants | France | 97.9 /100 | #99 | Exceptional 94.5% |
| Immigrants | South Central Asia | 97.8 /100 | #100 | Exceptional 94.5% |
| Syrians | 97.7 /100 | #101 | Exceptional 94.5% |
| Cambodians | 97.6 /100 | #102 | Exceptional 94.5% |
| Immigrants | Europe | 97.5 /100 | #103 | Exceptional 94.5% |
| Immigrants | Romania | 97.5 /100 | #104 | Exceptional 94.5% |
| Immigrants | Turkey | 97.4 /100 | #105 | Exceptional 94.5% |
| Immigrants | Serbia | 97.4 /100 | #106 | Exceptional 94.5% |
| Immigrants | Croatia | 97.4 /100 | #107 | Exceptional 94.5% |
| Immigrants | North Macedonia | 97.2 /100 | #108 | Exceptional 94.5% |
| Immigrants | Norway | 97.2 /100 | #109 | Exceptional 94.5% |