Hawaiian vs Immigrants from Sweden 10th Grade
COMPARE
Hawaiian
Immigrants from Sweden
10th Grade
10th Grade Comparison
Hawaiians
Immigrants from Sweden
93.5%
10TH GRADE
21.8/ 100
METRIC RATING
201st/ 347
METRIC RANK
94.9%
10TH GRADE
99.6/ 100
METRIC RATING
72nd/ 347
METRIC RANK
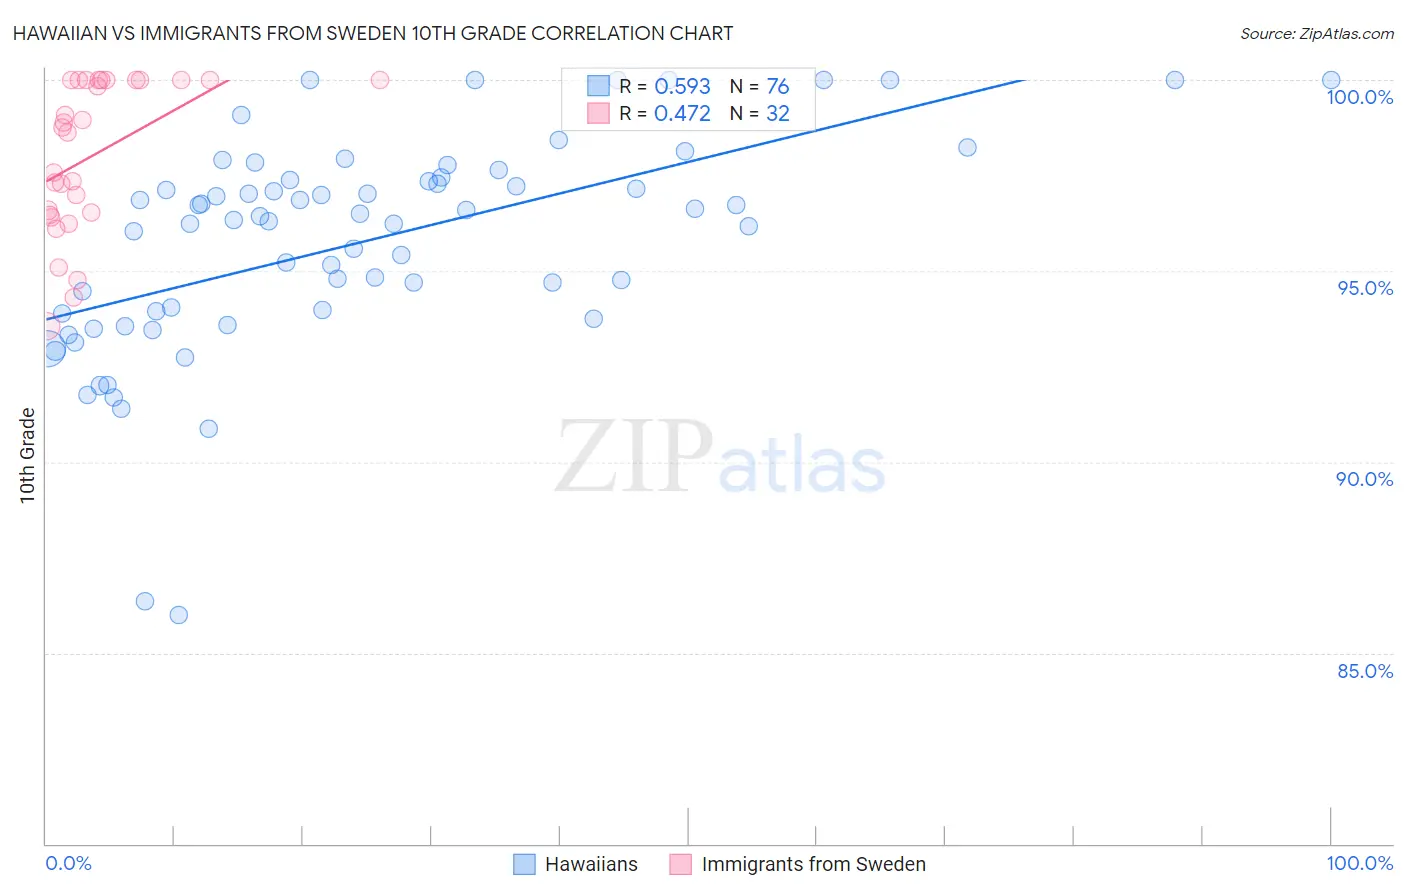
Hawaiian vs Immigrants from Sweden 10th Grade Correlation Chart
The statistical analysis conducted on geographies consisting of 327,620,881 people shows a substantial positive correlation between the proportion of Hawaiians and percentage of population with at least 10th grade education in the United States with a correlation coefficient (R) of 0.593 and weighted average of 93.5%. Similarly, the statistical analysis conducted on geographies consisting of 164,736,894 people shows a moderate positive correlation between the proportion of Immigrants from Sweden and percentage of population with at least 10th grade education in the United States with a correlation coefficient (R) of 0.472 and weighted average of 94.9%, a difference of 1.5%.
10th Grade Correlation Summary
| Measurement | Hawaiian | Immigrants from Sweden |
| Minimum | 86.0% | 93.5% |
| Maximum | 100.0% | 100.0% |
| Range | 14.0% | 6.5% |
| Mean | 95.7% | 98.0% |
| Median | 96.4% | 98.7% |
| Interquartile 25% (IQ1) | 93.9% | 96.5% |
| Interquartile 75% (IQ3) | 97.4% | 100.0% |
| Interquartile Range (IQR) | 3.5% | 3.5% |
| Standard Deviation (Sample) | 2.8% | 2.0% |
| Standard Deviation (Population) | 2.8% | 2.0% |
Similar Demographics by 10th Grade
Demographics Similar to Hawaiians by 10th Grade
In terms of 10th grade, the demographic groups most similar to Hawaiians are Hopi (93.5%, a difference of 0.0%), Immigrants from Uganda (93.5%, a difference of 0.010%), Immigrants from Micronesia (93.5%, a difference of 0.020%), Asian (93.5%, a difference of 0.020%), and Immigrants from Western Asia (93.4%, a difference of 0.020%).
| Demographics | Rating | Rank | 10th Grade |
| Immigrants | Morocco | 26.9 /100 | #194 | Fair 93.5% |
| Cheyenne | 26.8 /100 | #195 | Fair 93.5% |
| Moroccans | 25.3 /100 | #196 | Fair 93.5% |
| Pueblo | 23.9 /100 | #197 | Fair 93.5% |
| Immigrants | Micronesia | 23.2 /100 | #198 | Fair 93.5% |
| Asians | 23.0 /100 | #199 | Fair 93.5% |
| Hopi | 22.2 /100 | #200 | Fair 93.5% |
| Hawaiians | 21.8 /100 | #201 | Fair 93.5% |
| Immigrants | Uganda | 20.9 /100 | #202 | Fair 93.5% |
| Immigrants | Western Asia | 20.6 /100 | #203 | Fair 93.4% |
| Ute | 20.3 /100 | #204 | Fair 93.4% |
| Immigrants | Indonesia | 20.2 /100 | #205 | Fair 93.4% |
| Immigrants | Sudan | 20.0 /100 | #206 | Fair 93.4% |
| Samoans | 19.5 /100 | #207 | Poor 93.4% |
| Immigrants | Syria | 19.4 /100 | #208 | Poor 93.4% |
Demographics Similar to Immigrants from Sweden by 10th Grade
In terms of 10th grade, the demographic groups most similar to Immigrants from Sweden are Bhutanese (94.9%, a difference of 0.010%), Canadian (94.9%, a difference of 0.010%), Zimbabwean (94.9%, a difference of 0.020%), Alaska Native (94.9%, a difference of 0.020%), and Immigrants from England (94.9%, a difference of 0.030%).
| Demographics | Rating | Rank | 10th Grade |
| Turks | 99.7 /100 | #65 | Exceptional 95.0% |
| Immigrants | Australia | 99.7 /100 | #66 | Exceptional 94.9% |
| Immigrants | Netherlands | 99.7 /100 | #67 | Exceptional 94.9% |
| Immigrants | Belgium | 99.7 /100 | #68 | Exceptional 94.9% |
| Immigrants | England | 99.6 /100 | #69 | Exceptional 94.9% |
| Zimbabweans | 99.6 /100 | #70 | Exceptional 94.9% |
| Alaska Natives | 99.6 /100 | #71 | Exceptional 94.9% |
| Immigrants | Sweden | 99.6 /100 | #72 | Exceptional 94.9% |
| Bhutanese | 99.6 /100 | #73 | Exceptional 94.9% |
| Canadians | 99.6 /100 | #74 | Exceptional 94.9% |
| Okinawans | 99.5 /100 | #75 | Exceptional 94.8% |
| Romanians | 99.5 /100 | #76 | Exceptional 94.8% |
| Immigrants | South Africa | 99.5 /100 | #77 | Exceptional 94.8% |
| Filipinos | 99.3 /100 | #78 | Exceptional 94.8% |
| Immigrants | Czechoslovakia | 99.2 /100 | #79 | Exceptional 94.7% |