Hawaiian vs Cuban 10th Grade
COMPARE
Hawaiian
Cuban
10th Grade
10th Grade Comparison
Hawaiians
Cubans
93.5%
10TH GRADE
21.8/ 100
METRIC RATING
201st/ 347
METRIC RANK
91.5%
10TH GRADE
0.0/ 100
METRIC RATING
298th/ 347
METRIC RANK
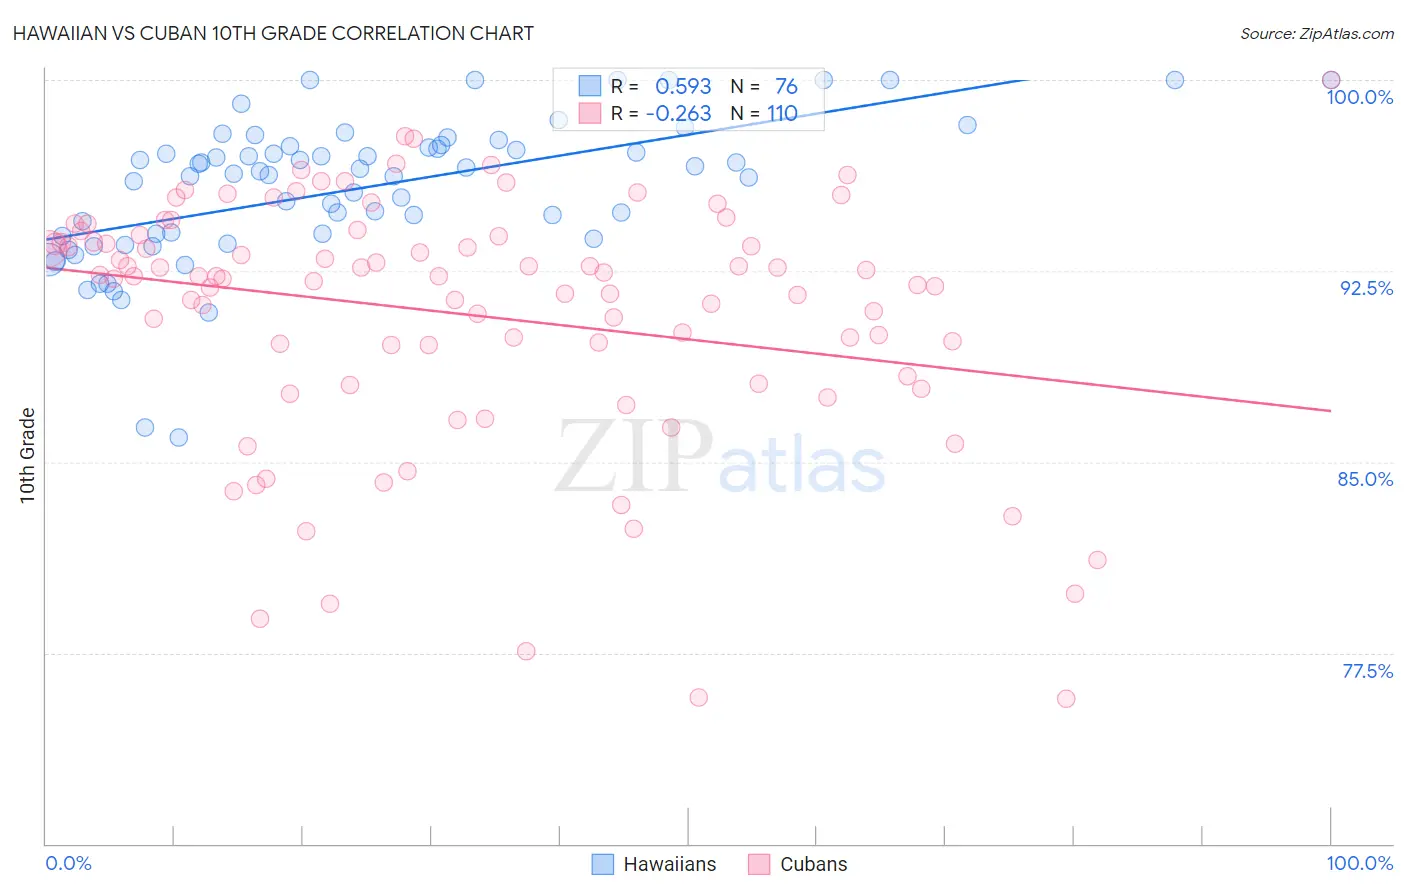
Hawaiian vs Cuban 10th Grade Correlation Chart
The statistical analysis conducted on geographies consisting of 327,620,881 people shows a substantial positive correlation between the proportion of Hawaiians and percentage of population with at least 10th grade education in the United States with a correlation coefficient (R) of 0.593 and weighted average of 93.5%. Similarly, the statistical analysis conducted on geographies consisting of 449,373,052 people shows a weak negative correlation between the proportion of Cubans and percentage of population with at least 10th grade education in the United States with a correlation coefficient (R) of -0.263 and weighted average of 91.5%, a difference of 2.2%.
10th Grade Correlation Summary
| Measurement | Hawaiian | Cuban |
| Minimum | 86.0% | 75.7% |
| Maximum | 100.0% | 100.0% |
| Range | 14.0% | 24.3% |
| Mean | 95.7% | 90.8% |
| Median | 96.4% | 92.3% |
| Interquartile 25% (IQ1) | 93.9% | 88.3% |
| Interquartile 75% (IQ3) | 97.4% | 93.9% |
| Interquartile Range (IQR) | 3.5% | 5.5% |
| Standard Deviation (Sample) | 2.8% | 4.9% |
| Standard Deviation (Population) | 2.8% | 4.9% |
Similar Demographics by 10th Grade
Demographics Similar to Hawaiians by 10th Grade
In terms of 10th grade, the demographic groups most similar to Hawaiians are Hopi (93.5%, a difference of 0.0%), Immigrants from Uganda (93.5%, a difference of 0.010%), Immigrants from Micronesia (93.5%, a difference of 0.020%), Asian (93.5%, a difference of 0.020%), and Immigrants from Western Asia (93.4%, a difference of 0.020%).
| Demographics | Rating | Rank | 10th Grade |
| Immigrants | Morocco | 26.9 /100 | #194 | Fair 93.5% |
| Cheyenne | 26.8 /100 | #195 | Fair 93.5% |
| Moroccans | 25.3 /100 | #196 | Fair 93.5% |
| Pueblo | 23.9 /100 | #197 | Fair 93.5% |
| Immigrants | Micronesia | 23.2 /100 | #198 | Fair 93.5% |
| Asians | 23.0 /100 | #199 | Fair 93.5% |
| Hopi | 22.2 /100 | #200 | Fair 93.5% |
| Hawaiians | 21.8 /100 | #201 | Fair 93.5% |
| Immigrants | Uganda | 20.9 /100 | #202 | Fair 93.5% |
| Immigrants | Western Asia | 20.6 /100 | #203 | Fair 93.4% |
| Ute | 20.3 /100 | #204 | Fair 93.4% |
| Immigrants | Indonesia | 20.2 /100 | #205 | Fair 93.4% |
| Immigrants | Sudan | 20.0 /100 | #206 | Fair 93.4% |
| Samoans | 19.5 /100 | #207 | Poor 93.4% |
| Immigrants | Syria | 19.4 /100 | #208 | Poor 93.4% |
Demographics Similar to Cubans by 10th Grade
In terms of 10th grade, the demographic groups most similar to Cubans are Fijian (91.5%, a difference of 0.020%), Immigrants from Haiti (91.4%, a difference of 0.080%), Guyanese (91.4%, a difference of 0.12%), Immigrants from Grenada (91.6%, a difference of 0.17%), and Japanese (91.2%, a difference of 0.27%).
| Demographics | Rating | Rank | 10th Grade |
| Immigrants | West Indies | 0.0 /100 | #291 | Tragic 91.8% |
| Immigrants | Burma/Myanmar | 0.0 /100 | #292 | Tragic 91.8% |
| Indonesians | 0.0 /100 | #293 | Tragic 91.8% |
| Haitians | 0.0 /100 | #294 | Tragic 91.8% |
| Lumbee | 0.0 /100 | #295 | Tragic 91.7% |
| Immigrants | Grenada | 0.0 /100 | #296 | Tragic 91.6% |
| Fijians | 0.0 /100 | #297 | Tragic 91.5% |
| Cubans | 0.0 /100 | #298 | Tragic 91.5% |
| Immigrants | Haiti | 0.0 /100 | #299 | Tragic 91.4% |
| Guyanese | 0.0 /100 | #300 | Tragic 91.4% |
| Japanese | 0.0 /100 | #301 | Tragic 91.2% |
| Immigrants | Guyana | 0.0 /100 | #302 | Tragic 91.2% |
| Immigrants | Vietnam | 0.0 /100 | #303 | Tragic 91.2% |
| Pima | 0.0 /100 | #304 | Tragic 91.2% |
| Immigrants | Dominica | 0.0 /100 | #305 | Tragic 91.1% |