Native/Alaskan vs Immigrants from Cambodia 10th Grade
COMPARE
Native/Alaskan
Immigrants from Cambodia
10th Grade
10th Grade Comparison
Natives/Alaskans
Immigrants from Cambodia
92.2%
10TH GRADE
0.1/ 100
METRIC RATING
279th/ 347
METRIC RANK
90.9%
10TH GRADE
0.0/ 100
METRIC RATING
311th/ 347
METRIC RANK
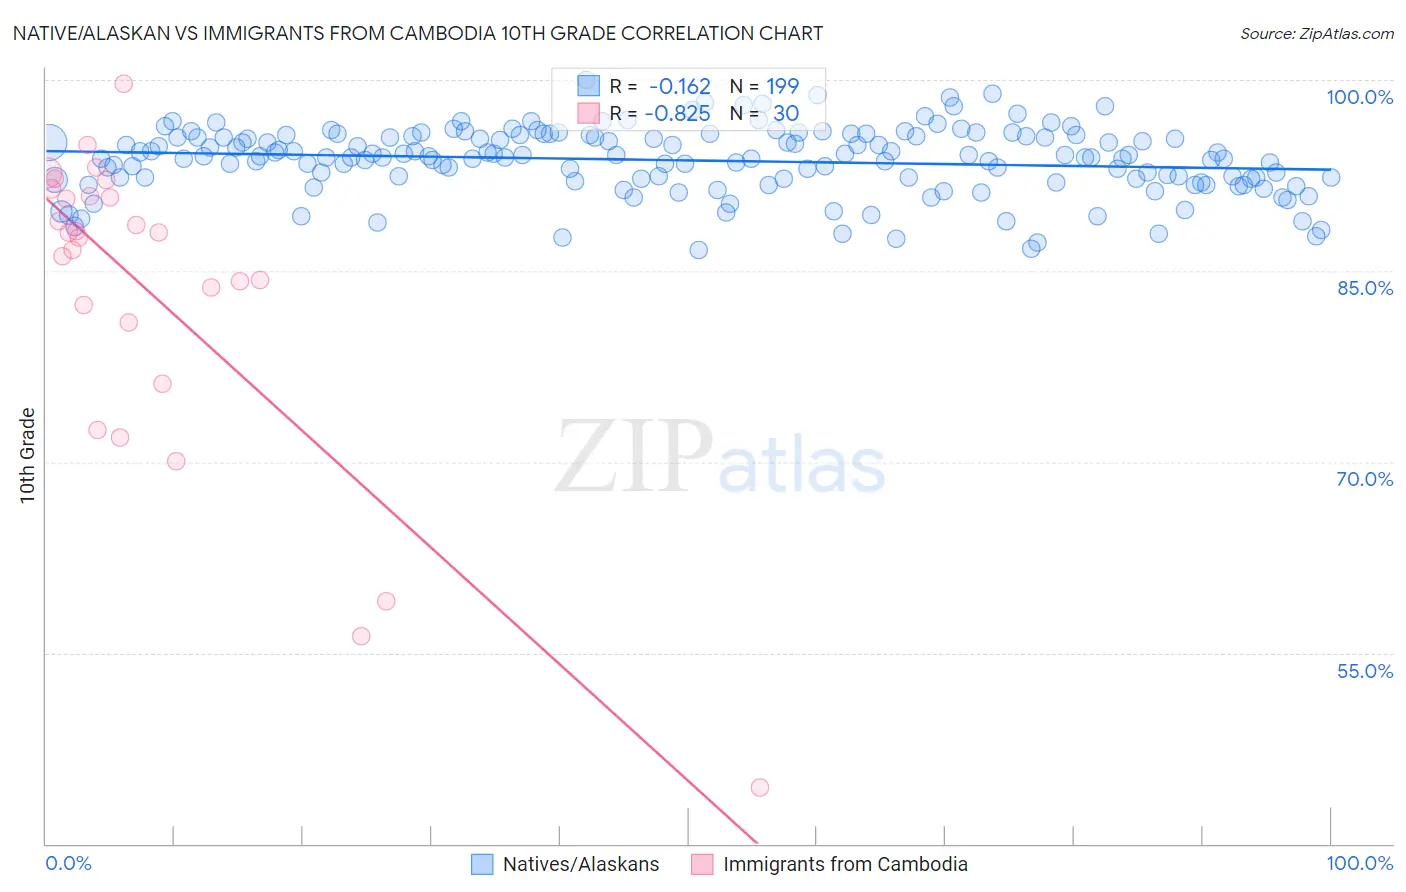
Native/Alaskan vs Immigrants from Cambodia 10th Grade Correlation Chart
The statistical analysis conducted on geographies consisting of 513,060,394 people shows a poor negative correlation between the proportion of Natives/Alaskans and percentage of population with at least 10th grade education in the United States with a correlation coefficient (R) of -0.162 and weighted average of 92.2%. Similarly, the statistical analysis conducted on geographies consisting of 205,153,442 people shows a very strong negative correlation between the proportion of Immigrants from Cambodia and percentage of population with at least 10th grade education in the United States with a correlation coefficient (R) of -0.825 and weighted average of 90.9%, a difference of 1.4%.
10th Grade Correlation Summary
| Measurement | Native/Alaskan | Immigrants from Cambodia |
| Minimum | 86.7% | 44.4% |
| Maximum | 100.0% | 99.7% |
| Range | 13.3% | 55.2% |
| Mean | 93.7% | 83.2% |
| Median | 93.9% | 87.8% |
| Interquartile 25% (IQ1) | 92.3% | 80.9% |
| Interquartile 75% (IQ3) | 95.6% | 90.8% |
| Interquartile Range (IQR) | 3.3% | 9.9% |
| Standard Deviation (Sample) | 2.6% | 12.4% |
| Standard Deviation (Population) | 2.6% | 12.2% |
Similar Demographics by 10th Grade
Demographics Similar to Natives/Alaskans by 10th Grade
In terms of 10th grade, the demographic groups most similar to Natives/Alaskans are Barbadian (92.2%, a difference of 0.010%), Malaysian (92.2%, a difference of 0.030%), Navajo (92.3%, a difference of 0.040%), Bangladeshi (92.2%, a difference of 0.040%), and Immigrants from Peru (92.2%, a difference of 0.060%).
| Demographics | Rating | Rank | 10th Grade |
| Immigrants | Western Africa | 0.3 /100 | #272 | Tragic 92.5% |
| Trinidadians and Tobagonians | 0.2 /100 | #273 | Tragic 92.4% |
| Immigrants | Congo | 0.2 /100 | #274 | Tragic 92.4% |
| West Indians | 0.2 /100 | #275 | Tragic 92.4% |
| Immigrants | Trinidad and Tobago | 0.1 /100 | #276 | Tragic 92.3% |
| Navajo | 0.1 /100 | #277 | Tragic 92.3% |
| Barbadians | 0.1 /100 | #278 | Tragic 92.2% |
| Natives/Alaskans | 0.1 /100 | #279 | Tragic 92.2% |
| Malaysians | 0.1 /100 | #280 | Tragic 92.2% |
| Bangladeshis | 0.1 /100 | #281 | Tragic 92.2% |
| Immigrants | Peru | 0.1 /100 | #282 | Tragic 92.2% |
| Immigrants | St. Vincent and the Grenadines | 0.0 /100 | #283 | Tragic 92.1% |
| Immigrants | Barbados | 0.0 /100 | #284 | Tragic 92.1% |
| Immigrants | South Eastern Asia | 0.0 /100 | #285 | Tragic 92.1% |
| Yuman | 0.0 /100 | #286 | Tragic 92.0% |
Demographics Similar to Immigrants from Cambodia by 10th Grade
In terms of 10th grade, the demographic groups most similar to Immigrants from Cambodia are Vietnamese (90.9%, a difference of 0.020%), Immigrants (91.0%, a difference of 0.060%), Immigrants from Bangladesh (91.0%, a difference of 0.10%), Immigrants from Fiji (91.0%, a difference of 0.11%), and Immigrants from Portugal (90.8%, a difference of 0.16%).
| Demographics | Rating | Rank | 10th Grade |
| Pima | 0.0 /100 | #304 | Tragic 91.2% |
| Immigrants | Dominica | 0.0 /100 | #305 | Tragic 91.1% |
| Yaqui | 0.0 /100 | #306 | Tragic 91.1% |
| Immigrants | Fiji | 0.0 /100 | #307 | Tragic 91.0% |
| Immigrants | Bangladesh | 0.0 /100 | #308 | Tragic 91.0% |
| Immigrants | Immigrants | 0.0 /100 | #309 | Tragic 91.0% |
| Vietnamese | 0.0 /100 | #310 | Tragic 90.9% |
| Immigrants | Cambodia | 0.0 /100 | #311 | Tragic 90.9% |
| Immigrants | Portugal | 0.0 /100 | #312 | Tragic 90.8% |
| Cape Verdeans | 0.0 /100 | #313 | Tragic 90.8% |
| Nepalese | 0.0 /100 | #314 | Tragic 90.7% |
| Immigrants | Caribbean | 0.0 /100 | #315 | Tragic 90.6% |
| Ecuadorians | 0.0 /100 | #316 | Tragic 90.6% |
| Immigrants | Ecuador | 0.0 /100 | #317 | Tragic 90.4% |
| Immigrants | Cuba | 0.0 /100 | #318 | Tragic 90.2% |