Haitian vs Scottish Vision Disability
COMPARE
Haitian
Scottish
Vision Disability
Vision Disability Comparison
Haitians
Scottish
2.4%
VISION DISABILITY
0.3/ 100
METRIC RATING
254th/ 347
METRIC RANK
2.3%
VISION DISABILITY
1.6/ 100
METRIC RATING
234th/ 347
METRIC RANK
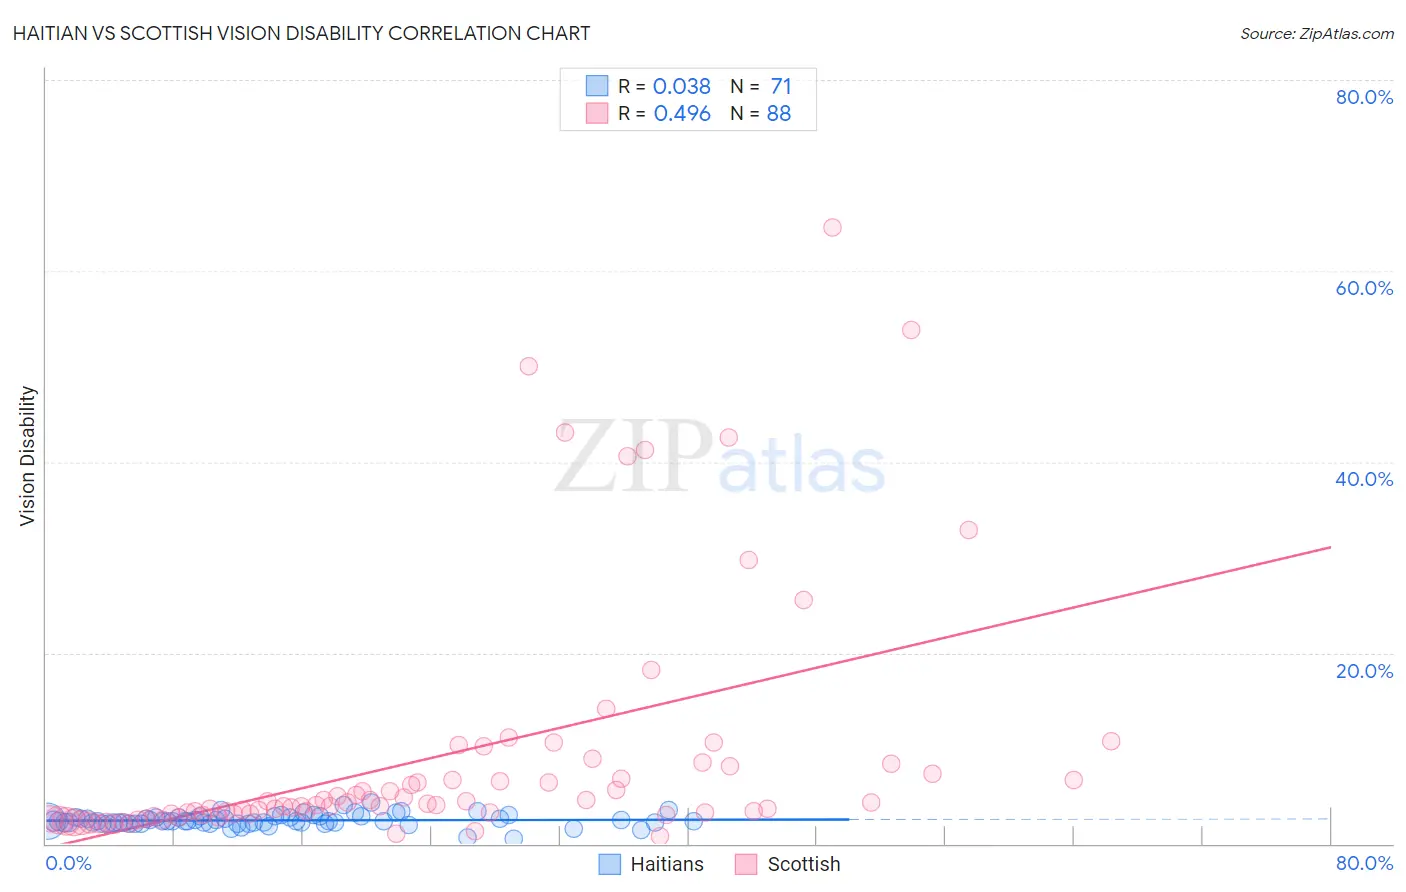
Haitian vs Scottish Vision Disability Correlation Chart
The statistical analysis conducted on geographies consisting of 287,754,917 people shows no correlation between the proportion of Haitians and percentage of population with vision disability in the United States with a correlation coefficient (R) of 0.038 and weighted average of 2.4%. Similarly, the statistical analysis conducted on geographies consisting of 565,142,315 people shows a moderate positive correlation between the proportion of Scottish and percentage of population with vision disability in the United States with a correlation coefficient (R) of 0.496 and weighted average of 2.3%, a difference of 2.6%.
Vision Disability Correlation Summary
| Measurement | Haitian | Scottish |
| Minimum | 0.56% | 0.83% |
| Maximum | 4.3% | 64.6% |
| Range | 3.7% | 63.8% |
| Mean | 2.5% | 9.1% |
| Median | 2.3% | 4.1% |
| Interquartile 25% (IQ1) | 2.2% | 3.0% |
| Interquartile 75% (IQ3) | 2.8% | 7.7% |
| Interquartile Range (IQR) | 0.57% | 4.7% |
| Standard Deviation (Sample) | 0.62% | 12.9% |
| Standard Deviation (Population) | 0.61% | 12.8% |
Demographics Similar to Haitians and Scottish by Vision Disability
In terms of vision disability, the demographic groups most similar to Haitians are Japanese (2.4%, a difference of 0.28%), Immigrants from Micronesia (2.4%, a difference of 0.35%), Immigrants from Laos (2.4%, a difference of 0.67%), Bangladeshi (2.3%, a difference of 0.78%), and Liberian (2.3%, a difference of 0.86%). Similarly, the demographic groups most similar to Scottish are Marshallese (2.3%, a difference of 0.070%), Immigrants from Congo (2.3%, a difference of 0.16%), Immigrants from Portugal (2.3%, a difference of 0.21%), Immigrants from Cambodia (2.3%, a difference of 0.48%), and English (2.3%, a difference of 0.50%).
| Demographics | Rating | Rank | Vision Disability |
| Scottish | 1.6 /100 | #234 | Tragic 2.3% |
| Marshallese | 1.5 /100 | #235 | Tragic 2.3% |
| Immigrants | Congo | 1.4 /100 | #236 | Tragic 2.3% |
| Immigrants | Portugal | 1.4 /100 | #237 | Tragic 2.3% |
| Immigrants | Cambodia | 1.1 /100 | #238 | Tragic 2.3% |
| English | 1.1 /100 | #239 | Tragic 2.3% |
| Panamanians | 0.9 /100 | #240 | Tragic 2.3% |
| Malaysians | 0.9 /100 | #241 | Tragic 2.3% |
| Immigrants | Panama | 0.8 /100 | #242 | Tragic 2.3% |
| Immigrants | Nicaragua | 0.6 /100 | #243 | Tragic 2.3% |
| Immigrants | West Indies | 0.6 /100 | #244 | Tragic 2.3% |
| Alsatians | 0.6 /100 | #245 | Tragic 2.3% |
| French | 0.5 /100 | #246 | Tragic 2.3% |
| Guatemalans | 0.5 /100 | #247 | Tragic 2.3% |
| Sub-Saharan Africans | 0.5 /100 | #248 | Tragic 2.3% |
| Liberians | 0.5 /100 | #249 | Tragic 2.3% |
| Bangladeshis | 0.5 /100 | #250 | Tragic 2.3% |
| Immigrants | Laos | 0.4 /100 | #251 | Tragic 2.4% |
| Immigrants | Micronesia | 0.3 /100 | #252 | Tragic 2.4% |
| Japanese | 0.3 /100 | #253 | Tragic 2.4% |
| Haitians | 0.3 /100 | #254 | Tragic 2.4% |