Immigrants from Oceania vs Immigrants from Italy High School Diploma
COMPARE
Immigrants from Oceania
Immigrants from Italy
High School Diploma
High School Diploma Comparison
Immigrants from Oceania
Immigrants from Italy
88.8%
HIGH SCHOOL DIPLOMA
26.9/ 100
METRIC RATING
193rd/ 347
METRIC RANK
89.8%
HIGH SCHOOL DIPLOMA
87.4/ 100
METRIC RATING
131st/ 347
METRIC RANK
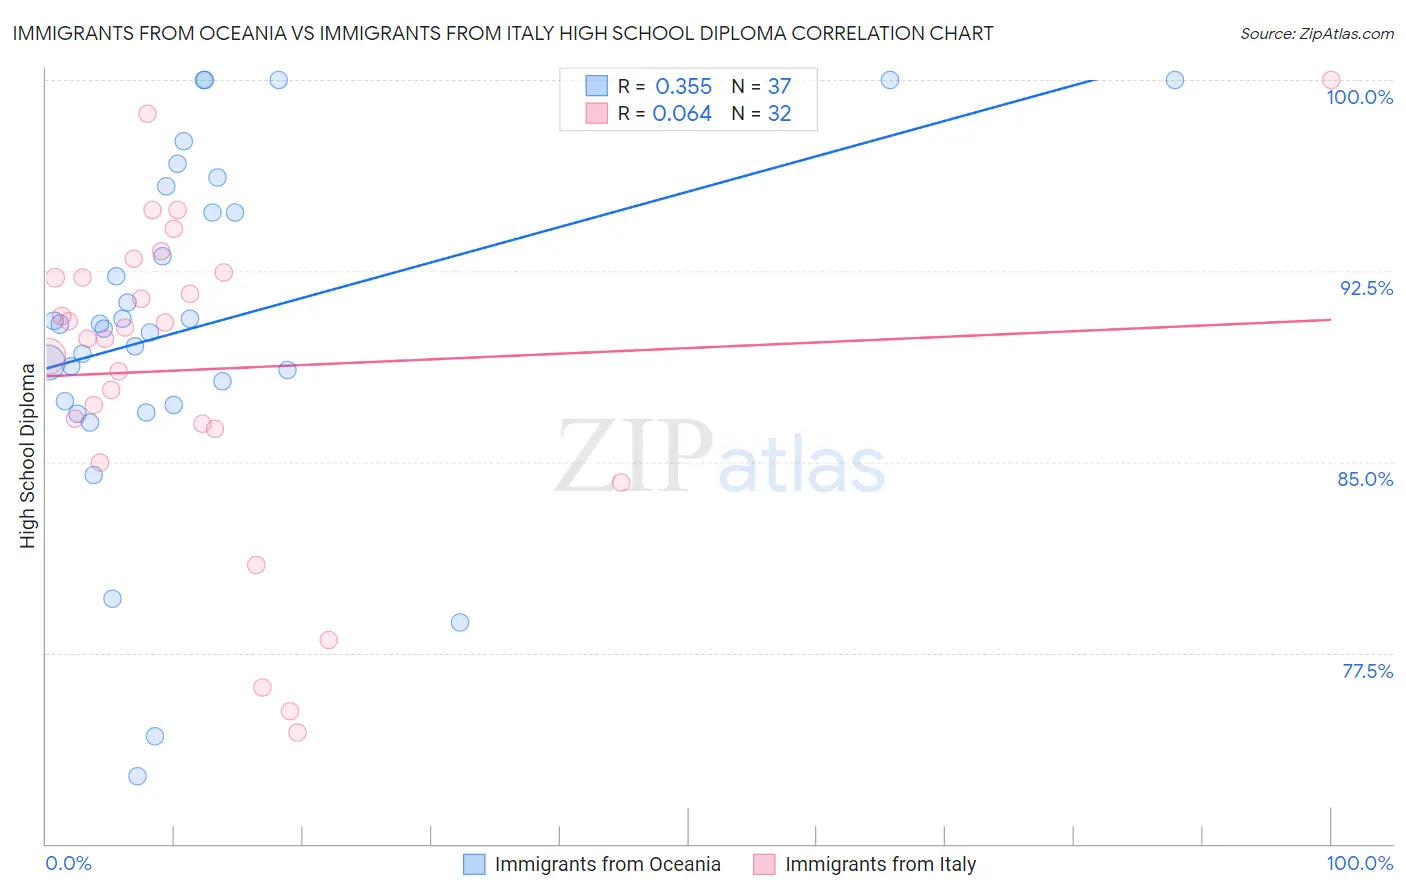
Immigrants from Oceania vs Immigrants from Italy High School Diploma Correlation Chart
The statistical analysis conducted on geographies consisting of 305,521,521 people shows a mild positive correlation between the proportion of Immigrants from Oceania and percentage of population with at least high school diploma education in the United States with a correlation coefficient (R) of 0.355 and weighted average of 88.8%. Similarly, the statistical analysis conducted on geographies consisting of 324,226,009 people shows a slight positive correlation between the proportion of Immigrants from Italy and percentage of population with at least high school diploma education in the United States with a correlation coefficient (R) of 0.064 and weighted average of 89.8%, a difference of 1.1%.
High School Diploma Correlation Summary
| Measurement | Immigrants from Oceania | Immigrants from Italy |
| Minimum | 72.6% | 74.4% |
| Maximum | 100.0% | 100.0% |
| Range | 27.4% | 25.6% |
| Mean | 90.4% | 88.6% |
| Median | 90.4% | 90.0% |
| Interquartile 25% (IQ1) | 87.3% | 86.4% |
| Interquartile 75% (IQ3) | 95.3% | 92.3% |
| Interquartile Range (IQR) | 8.0% | 6.0% |
| Standard Deviation (Sample) | 6.7% | 6.3% |
| Standard Deviation (Population) | 6.6% | 6.2% |
Similar Demographics by High School Diploma
Demographics Similar to Immigrants from Oceania by High School Diploma
In terms of high school diploma, the demographic groups most similar to Immigrants from Oceania are Immigrants from Venezuela (88.8%, a difference of 0.020%), Moroccan (88.8%, a difference of 0.050%), Afghan (88.8%, a difference of 0.060%), Immigrants from Ethiopia (88.9%, a difference of 0.070%), and Immigrants from Southern Europe (88.7%, a difference of 0.070%).
| Demographics | Rating | Rank | High School Diploma |
| Immigrants | Eastern Africa | 35.8 /100 | #186 | Fair 88.9% |
| Guamanians/Chamorros | 35.5 /100 | #187 | Fair 88.9% |
| Immigrants | Sudan | 33.4 /100 | #188 | Fair 88.9% |
| Immigrants | Uganda | 32.6 /100 | #189 | Fair 88.9% |
| Immigrants | Chile | 31.9 /100 | #190 | Fair 88.9% |
| Immigrants | Ethiopia | 30.9 /100 | #191 | Fair 88.9% |
| Moroccans | 29.5 /100 | #192 | Fair 88.8% |
| Immigrants | Oceania | 26.9 /100 | #193 | Fair 88.8% |
| Immigrants | Venezuela | 25.8 /100 | #194 | Fair 88.8% |
| Afghans | 23.9 /100 | #195 | Fair 88.8% |
| Immigrants | Southern Europe | 23.4 /100 | #196 | Fair 88.7% |
| French American Indians | 21.5 /100 | #197 | Fair 88.7% |
| Liberians | 18.8 /100 | #198 | Poor 88.7% |
| Marshallese | 18.7 /100 | #199 | Poor 88.6% |
| Hawaiians | 18.3 /100 | #200 | Poor 88.6% |
Demographics Similar to Immigrants from Italy by High School Diploma
In terms of high school diploma, the demographic groups most similar to Immigrants from Italy are Immigrants from Bosnia and Herzegovina (89.8%, a difference of 0.0%), Albanian (89.8%, a difference of 0.010%), Immigrants from Jordan (89.8%, a difference of 0.010%), Immigrants from Ukraine (89.8%, a difference of 0.020%), and Basque (89.8%, a difference of 0.040%).
| Demographics | Rating | Rank | High School Diploma |
| Mongolians | 91.6 /100 | #124 | Exceptional 89.9% |
| Egyptians | 91.1 /100 | #125 | Exceptional 89.9% |
| Alaska Natives | 91.0 /100 | #126 | Exceptional 89.9% |
| Immigrants | Eastern Asia | 89.2 /100 | #127 | Excellent 89.9% |
| Puget Sound Salish | 89.1 /100 | #128 | Excellent 89.9% |
| Basques | 88.5 /100 | #129 | Excellent 89.8% |
| Immigrants | Ukraine | 87.9 /100 | #130 | Excellent 89.8% |
| Immigrants | Italy | 87.4 /100 | #131 | Excellent 89.8% |
| Immigrants | Bosnia and Herzegovina | 87.3 /100 | #132 | Excellent 89.8% |
| Albanians | 87.2 /100 | #133 | Excellent 89.8% |
| Immigrants | Jordan | 87.2 /100 | #134 | Excellent 89.8% |
| Chippewa | 85.6 /100 | #135 | Excellent 89.7% |
| Ugandans | 83.7 /100 | #136 | Excellent 89.7% |
| Arabs | 83.6 /100 | #137 | Excellent 89.7% |
| Assyrians/Chaldeans/Syriacs | 82.5 /100 | #138 | Excellent 89.7% |