Nigerian vs British West Indian College, 1 year or more
COMPARE
Nigerian
British West Indian
College, 1 year or more
College, 1 year or more Comparison
Nigerians
British West Indians
58.5%
COLLEGE, 1 YEAR OR MORE
23.0/ 100
METRIC RATING
201st/ 347
METRIC RANK
54.5%
COLLEGE, 1 YEAR OR MORE
0.2/ 100
METRIC RATING
268th/ 347
METRIC RANK
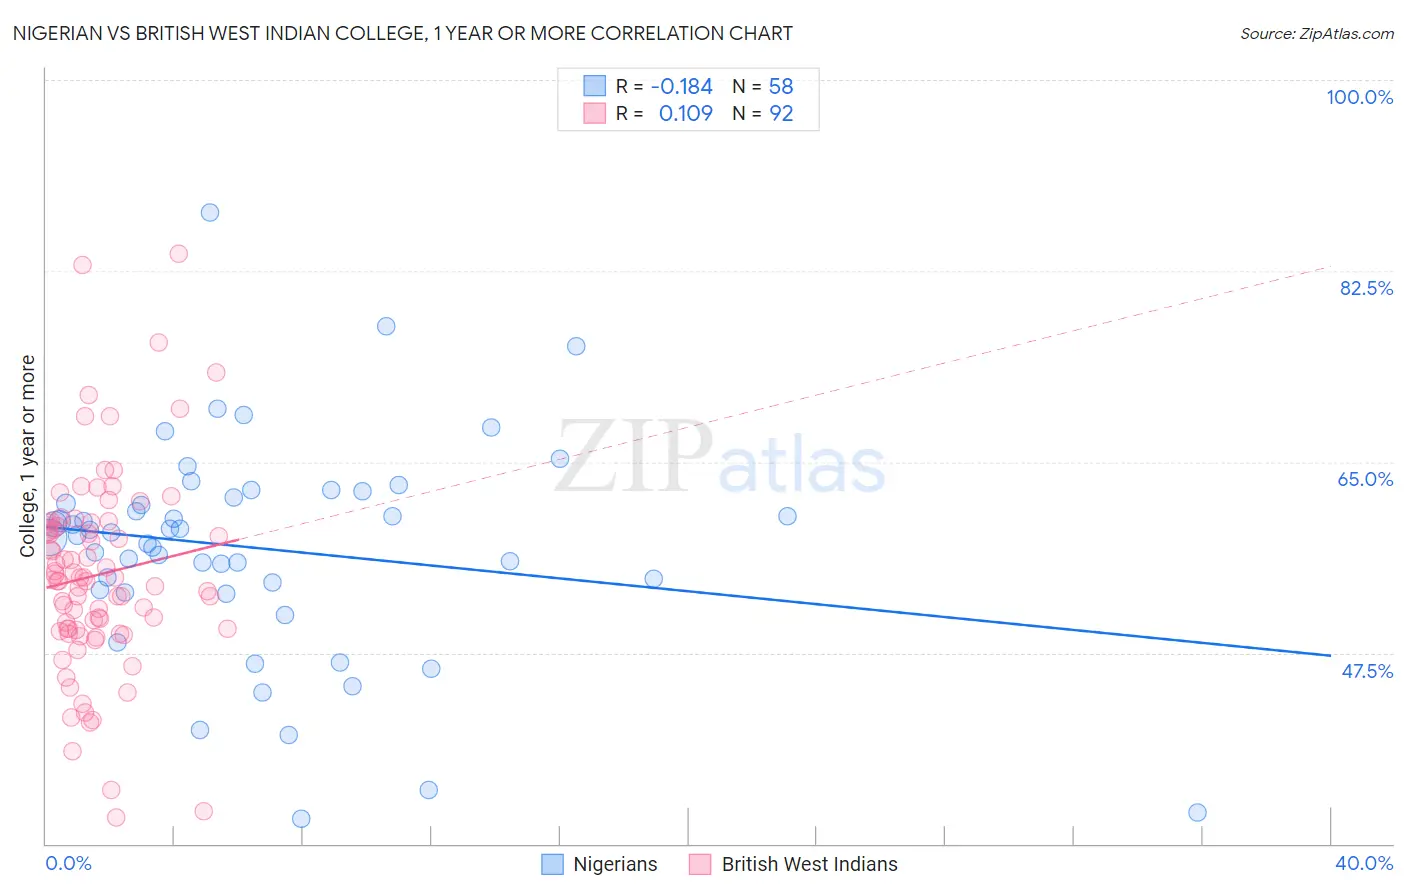
Nigerian vs British West Indian College, 1 year or more Correlation Chart
The statistical analysis conducted on geographies consisting of 332,779,766 people shows a poor negative correlation between the proportion of Nigerians and percentage of population with at least college, 1 year or more education in the United States with a correlation coefficient (R) of -0.184 and weighted average of 58.5%. Similarly, the statistical analysis conducted on geographies consisting of 152,694,627 people shows a poor positive correlation between the proportion of British West Indians and percentage of population with at least college, 1 year or more education in the United States with a correlation coefficient (R) of 0.109 and weighted average of 54.5%, a difference of 7.2%.
College, 1 year or more Correlation Summary
| Measurement | Nigerian | British West Indian |
| Minimum | 32.3% | 32.4% |
| Maximum | 87.8% | 84.0% |
| Range | 55.5% | 51.6% |
| Mean | 57.1% | 54.6% |
| Median | 58.4% | 54.1% |
| Interquartile 25% (IQ1) | 53.2% | 49.6% |
| Interquartile 75% (IQ3) | 61.7% | 59.2% |
| Interquartile Range (IQR) | 8.5% | 9.6% |
| Standard Deviation (Sample) | 10.1% | 9.2% |
| Standard Deviation (Population) | 10.0% | 9.1% |
Similar Demographics by College, 1 year or more
Demographics Similar to Nigerians by College, 1 year or more
In terms of college, 1 year or more, the demographic groups most similar to Nigerians are Immigrants from South America (58.4%, a difference of 0.080%), Spanish (58.5%, a difference of 0.090%), Slovak (58.5%, a difference of 0.12%), Immigrants from South Eastern Asia (58.5%, a difference of 0.15%), and Ghanaian (58.4%, a difference of 0.17%).
| Demographics | Rating | Rank | College, 1 year or more |
| Costa Ricans | 26.4 /100 | #194 | Fair 58.6% |
| Dutch | 26.2 /100 | #195 | Fair 58.6% |
| Guamanians/Chamorros | 26.2 /100 | #196 | Fair 58.6% |
| Immigrants | Thailand | 26.0 /100 | #197 | Fair 58.6% |
| Immigrants | South Eastern Asia | 25.1 /100 | #198 | Fair 58.5% |
| Slovaks | 24.6 /100 | #199 | Fair 58.5% |
| Spanish | 24.2 /100 | #200 | Fair 58.5% |
| Nigerians | 23.0 /100 | #201 | Fair 58.5% |
| Immigrants | South America | 21.9 /100 | #202 | Fair 58.4% |
| Ghanaians | 20.9 /100 | #203 | Fair 58.4% |
| Panamanians | 19.2 /100 | #204 | Poor 58.3% |
| Immigrants | Zaire | 18.7 /100 | #205 | Poor 58.3% |
| Immigrants | Vietnam | 18.2 /100 | #206 | Poor 58.2% |
| Senegalese | 16.9 /100 | #207 | Poor 58.2% |
| Immigrants | Uruguay | 15.2 /100 | #208 | Poor 58.1% |
Demographics Similar to British West Indians by College, 1 year or more
In terms of college, 1 year or more, the demographic groups most similar to British West Indians are Bangladeshi (54.5%, a difference of 0.030%), Crow (54.5%, a difference of 0.070%), Bahamian (54.5%, a difference of 0.090%), Comanche (54.4%, a difference of 0.14%), and Blackfeet (54.6%, a difference of 0.16%).
| Demographics | Rating | Rank | College, 1 year or more |
| Ottawa | 0.3 /100 | #261 | Tragic 54.9% |
| Immigrants | St. Vincent and the Grenadines | 0.3 /100 | #262 | Tragic 54.8% |
| U.S. Virgin Islanders | 0.3 /100 | #263 | Tragic 54.8% |
| Immigrants | Micronesia | 0.3 /100 | #264 | Tragic 54.8% |
| Immigrants | Laos | 0.2 /100 | #265 | Tragic 54.7% |
| Potawatomi | 0.2 /100 | #266 | Tragic 54.6% |
| Blackfeet | 0.2 /100 | #267 | Tragic 54.6% |
| British West Indians | 0.2 /100 | #268 | Tragic 54.5% |
| Bangladeshis | 0.2 /100 | #269 | Tragic 54.5% |
| Crow | 0.2 /100 | #270 | Tragic 54.5% |
| Bahamians | 0.2 /100 | #271 | Tragic 54.5% |
| Comanche | 0.2 /100 | #272 | Tragic 54.4% |
| Immigrants | Grenada | 0.2 /100 | #273 | Tragic 54.4% |
| Belizeans | 0.2 /100 | #274 | Tragic 54.4% |
| Americans | 0.2 /100 | #275 | Tragic 54.4% |