Immigrants from Lebanon vs British West Indian College, 1 year or more
COMPARE
Immigrants from Lebanon
British West Indian
College, 1 year or more
College, 1 year or more Comparison
Immigrants from Lebanon
British West Indians
62.9%
COLLEGE, 1 YEAR OR MORE
98.8/ 100
METRIC RATING
78th/ 347
METRIC RANK
54.5%
COLLEGE, 1 YEAR OR MORE
0.2/ 100
METRIC RATING
268th/ 347
METRIC RANK
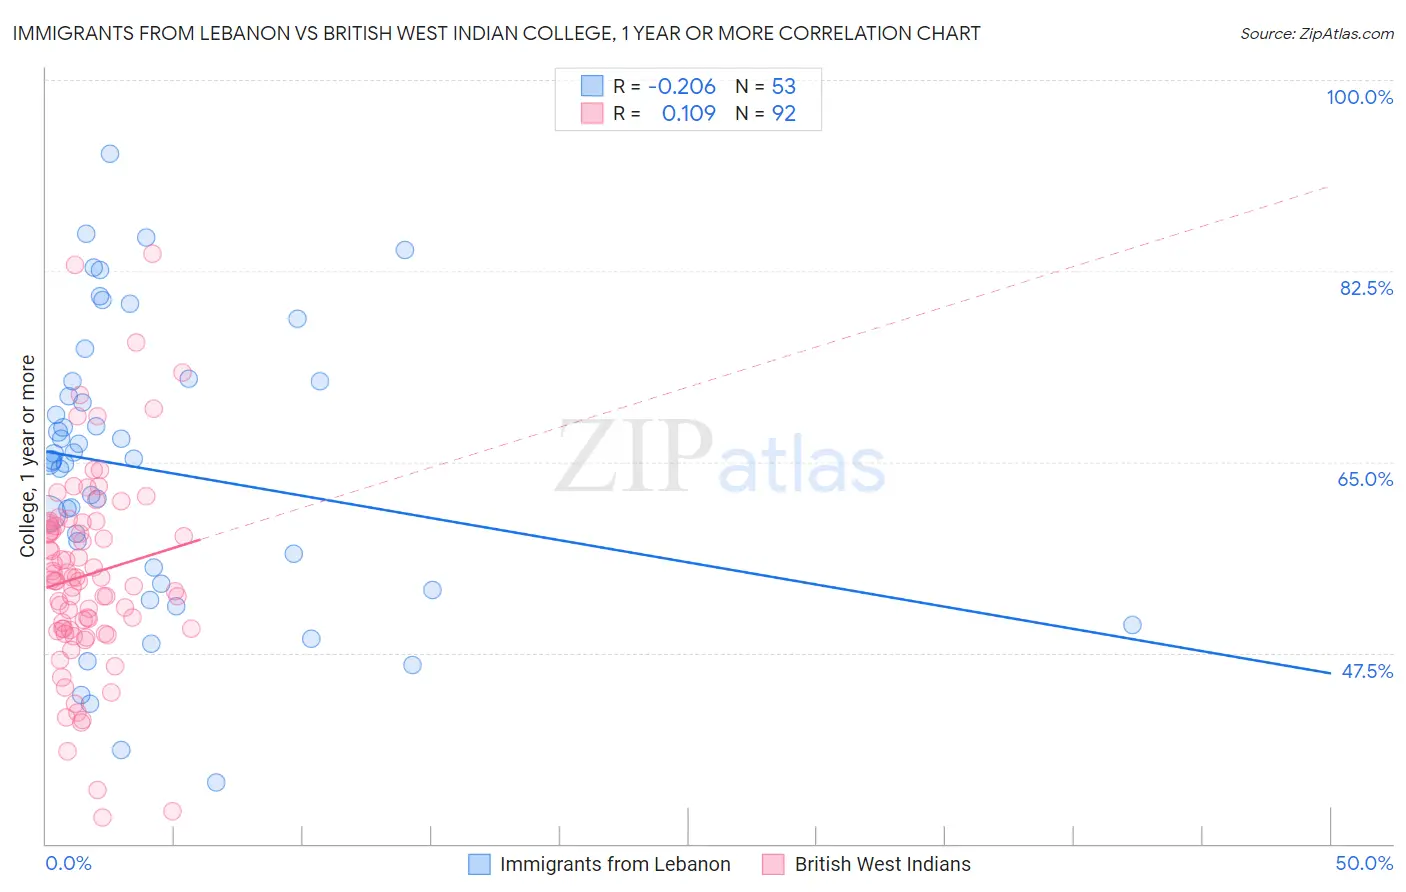
Immigrants from Lebanon vs British West Indian College, 1 year or more Correlation Chart
The statistical analysis conducted on geographies consisting of 217,164,247 people shows a weak negative correlation between the proportion of Immigrants from Lebanon and percentage of population with at least college, 1 year or more education in the United States with a correlation coefficient (R) of -0.206 and weighted average of 62.9%. Similarly, the statistical analysis conducted on geographies consisting of 152,694,627 people shows a poor positive correlation between the proportion of British West Indians and percentage of population with at least college, 1 year or more education in the United States with a correlation coefficient (R) of 0.109 and weighted average of 54.5%, a difference of 15.4%.
College, 1 year or more Correlation Summary
| Measurement | Immigrants from Lebanon | British West Indian |
| Minimum | 35.7% | 32.4% |
| Maximum | 93.2% | 84.0% |
| Range | 57.5% | 51.6% |
| Mean | 64.3% | 54.6% |
| Median | 65.2% | 54.1% |
| Interquartile 25% (IQ1) | 54.6% | 49.6% |
| Interquartile 75% (IQ3) | 72.4% | 59.2% |
| Interquartile Range (IQR) | 17.8% | 9.6% |
| Standard Deviation (Sample) | 13.0% | 9.2% |
| Standard Deviation (Population) | 12.9% | 9.1% |
Similar Demographics by College, 1 year or more
Demographics Similar to Immigrants from Lebanon by College, 1 year or more
In terms of college, 1 year or more, the demographic groups most similar to Immigrants from Lebanon are Northern European (62.9%, a difference of 0.010%), Paraguayan (62.9%, a difference of 0.020%), Ethiopian (62.9%, a difference of 0.020%), Lithuanian (62.9%, a difference of 0.050%), and Laotian (62.8%, a difference of 0.11%).
| Demographics | Rating | Rank | College, 1 year or more |
| Immigrants | Canada | 99.1 /100 | #71 | Exceptional 63.1% |
| Egyptians | 99.0 /100 | #72 | Exceptional 63.1% |
| Immigrants | Moldova | 99.0 /100 | #73 | Exceptional 63.0% |
| Immigrants | North America | 99.0 /100 | #74 | Exceptional 63.0% |
| Armenians | 98.9 /100 | #75 | Exceptional 63.0% |
| Paraguayans | 98.8 /100 | #76 | Exceptional 62.9% |
| Ethiopians | 98.8 /100 | #77 | Exceptional 62.9% |
| Immigrants | Lebanon | 98.8 /100 | #78 | Exceptional 62.9% |
| Northern Europeans | 98.8 /100 | #79 | Exceptional 62.9% |
| Lithuanians | 98.8 /100 | #80 | Exceptional 62.9% |
| Laotians | 98.7 /100 | #81 | Exceptional 62.8% |
| Immigrants | Bolivia | 98.7 /100 | #82 | Exceptional 62.8% |
| Immigrants | Argentina | 98.6 /100 | #83 | Exceptional 62.8% |
| Immigrants | England | 98.6 /100 | #84 | Exceptional 62.8% |
| Immigrants | Pakistan | 98.6 /100 | #85 | Exceptional 62.8% |
Demographics Similar to British West Indians by College, 1 year or more
In terms of college, 1 year or more, the demographic groups most similar to British West Indians are Bangladeshi (54.5%, a difference of 0.030%), Crow (54.5%, a difference of 0.070%), Bahamian (54.5%, a difference of 0.090%), Comanche (54.4%, a difference of 0.14%), and Blackfeet (54.6%, a difference of 0.16%).
| Demographics | Rating | Rank | College, 1 year or more |
| Ottawa | 0.3 /100 | #261 | Tragic 54.9% |
| Immigrants | St. Vincent and the Grenadines | 0.3 /100 | #262 | Tragic 54.8% |
| U.S. Virgin Islanders | 0.3 /100 | #263 | Tragic 54.8% |
| Immigrants | Micronesia | 0.3 /100 | #264 | Tragic 54.8% |
| Immigrants | Laos | 0.2 /100 | #265 | Tragic 54.7% |
| Potawatomi | 0.2 /100 | #266 | Tragic 54.6% |
| Blackfeet | 0.2 /100 | #267 | Tragic 54.6% |
| British West Indians | 0.2 /100 | #268 | Tragic 54.5% |
| Bangladeshis | 0.2 /100 | #269 | Tragic 54.5% |
| Crow | 0.2 /100 | #270 | Tragic 54.5% |
| Bahamians | 0.2 /100 | #271 | Tragic 54.5% |
| Comanche | 0.2 /100 | #272 | Tragic 54.4% |
| Immigrants | Grenada | 0.2 /100 | #273 | Tragic 54.4% |
| Belizeans | 0.2 /100 | #274 | Tragic 54.4% |
| Americans | 0.2 /100 | #275 | Tragic 54.4% |