Immigrants from South Central Asia vs Asian College, 1 year or more
COMPARE
Immigrants from South Central Asia
Asian
College, 1 year or more
College, 1 year or more Comparison
Immigrants from South Central Asia
Asians
67.1%
COLLEGE, 1 YEAR OR MORE
100.0/ 100
METRIC RATING
11th/ 347
METRIC RANK
64.2%
COLLEGE, 1 YEAR OR MORE
99.8/ 100
METRIC RATING
53rd/ 347
METRIC RANK
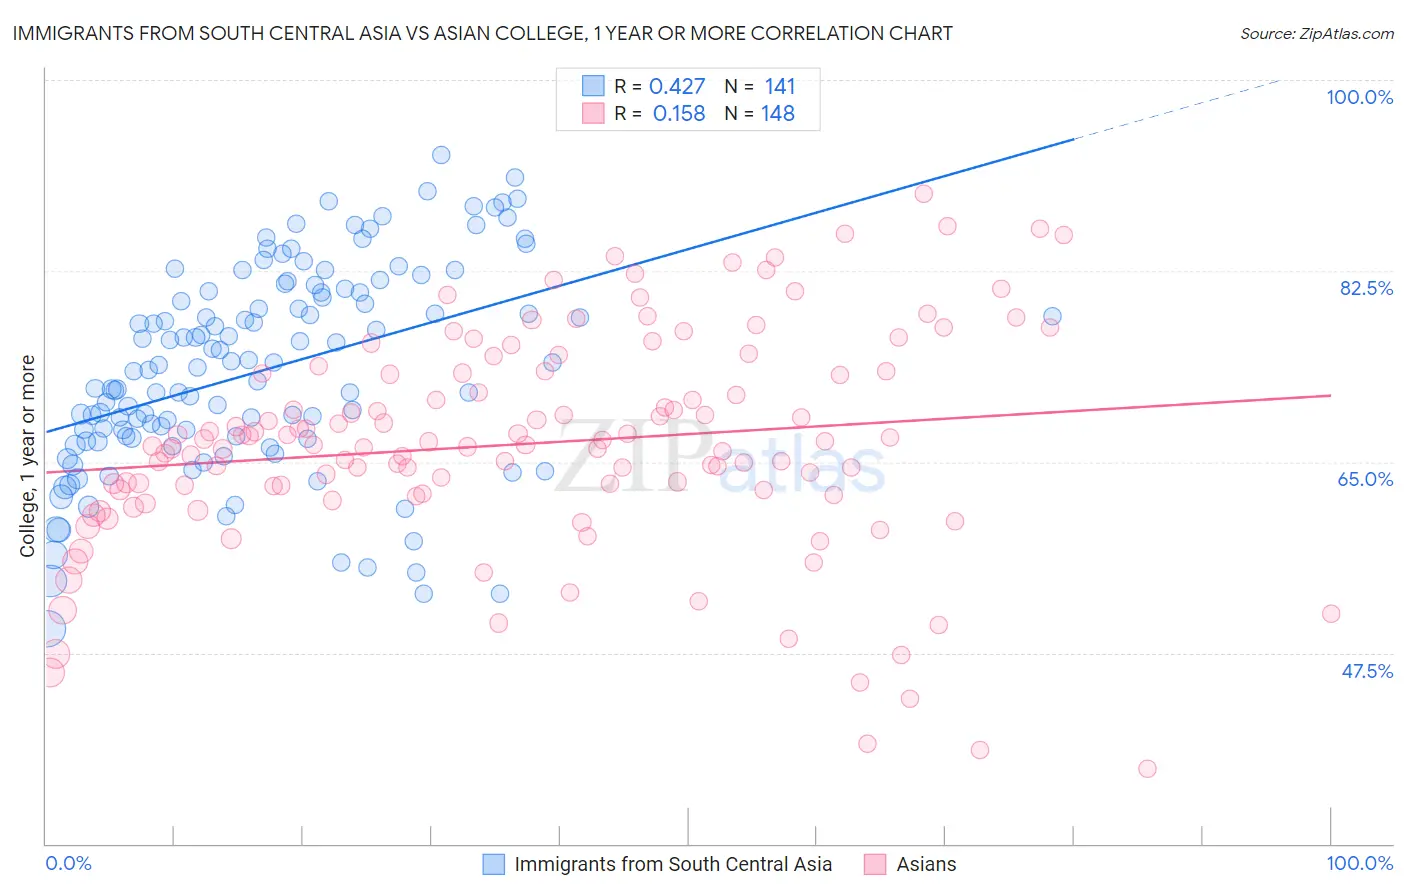
Immigrants from South Central Asia vs Asian College, 1 year or more Correlation Chart
The statistical analysis conducted on geographies consisting of 473,108,893 people shows a moderate positive correlation between the proportion of Immigrants from South Central Asia and percentage of population with at least college, 1 year or more education in the United States with a correlation coefficient (R) of 0.427 and weighted average of 67.1%. Similarly, the statistical analysis conducted on geographies consisting of 550,911,104 people shows a poor positive correlation between the proportion of Asians and percentage of population with at least college, 1 year or more education in the United States with a correlation coefficient (R) of 0.158 and weighted average of 64.2%, a difference of 4.6%.
College, 1 year or more Correlation Summary
| Measurement | Immigrants from South Central Asia | Asian |
| Minimum | 49.7% | 36.8% |
| Maximum | 93.2% | 89.5% |
| Range | 43.5% | 52.7% |
| Mean | 73.4% | 66.7% |
| Median | 73.7% | 66.6% |
| Interquartile 25% (IQ1) | 67.1% | 62.3% |
| Interquartile 75% (IQ3) | 80.6% | 73.1% |
| Interquartile Range (IQR) | 13.4% | 10.9% |
| Standard Deviation (Sample) | 9.4% | 10.0% |
| Standard Deviation (Population) | 9.3% | 10.0% |
Similar Demographics by College, 1 year or more
Demographics Similar to Immigrants from South Central Asia by College, 1 year or more
In terms of college, 1 year or more, the demographic groups most similar to Immigrants from South Central Asia are Cypriot (67.0%, a difference of 0.17%), Immigrants from Sweden (66.8%, a difference of 0.48%), Burmese (66.7%, a difference of 0.67%), Cambodian (66.7%, a difference of 0.67%), and Immigrants from Japan (66.7%, a difference of 0.71%).
| Demographics | Rating | Rank | College, 1 year or more |
| Immigrants | Taiwan | 100.0 /100 | #4 | Exceptional 69.6% |
| Immigrants | India | 100.0 /100 | #5 | Exceptional 69.6% |
| Immigrants | Iran | 100.0 /100 | #6 | Exceptional 69.5% |
| Okinawans | 100.0 /100 | #7 | Exceptional 69.0% |
| Thais | 100.0 /100 | #8 | Exceptional 68.6% |
| Immigrants | Israel | 100.0 /100 | #9 | Exceptional 67.8% |
| Immigrants | Australia | 100.0 /100 | #10 | Exceptional 67.7% |
| Immigrants | South Central Asia | 100.0 /100 | #11 | Exceptional 67.1% |
| Cypriots | 100.0 /100 | #12 | Exceptional 67.0% |
| Immigrants | Sweden | 100.0 /100 | #13 | Exceptional 66.8% |
| Burmese | 100.0 /100 | #14 | Exceptional 66.7% |
| Cambodians | 100.0 /100 | #15 | Exceptional 66.7% |
| Immigrants | Japan | 100.0 /100 | #16 | Exceptional 66.7% |
| Immigrants | Eastern Asia | 100.0 /100 | #17 | Exceptional 66.6% |
| Eastern Europeans | 100.0 /100 | #18 | Exceptional 66.6% |
Demographics Similar to Asians by College, 1 year or more
In terms of college, 1 year or more, the demographic groups most similar to Asians are Immigrants from Netherlands (64.2%, a difference of 0.020%), Zimbabwean (64.2%, a difference of 0.030%), Immigrants from Belarus (64.1%, a difference of 0.15%), Immigrants from Czechoslovakia (64.1%, a difference of 0.17%), and Immigrants from Malaysia (64.3%, a difference of 0.18%).
| Demographics | Rating | Rank | College, 1 year or more |
| Bhutanese | 99.9 /100 | #46 | Exceptional 64.6% |
| Australians | 99.9 /100 | #47 | Exceptional 64.6% |
| Immigrants | Bulgaria | 99.9 /100 | #48 | Exceptional 64.6% |
| New Zealanders | 99.9 /100 | #49 | Exceptional 64.6% |
| Immigrants | Austria | 99.8 /100 | #50 | Exceptional 64.4% |
| Immigrants | Malaysia | 99.8 /100 | #51 | Exceptional 64.3% |
| Immigrants | Netherlands | 99.8 /100 | #52 | Exceptional 64.2% |
| Asians | 99.8 /100 | #53 | Exceptional 64.2% |
| Zimbabweans | 99.8 /100 | #54 | Exceptional 64.2% |
| Immigrants | Belarus | 99.7 /100 | #55 | Exceptional 64.1% |
| Immigrants | Czechoslovakia | 99.7 /100 | #56 | Exceptional 64.1% |
| South Africans | 99.7 /100 | #57 | Exceptional 64.1% |
| Immigrants | Asia | 99.7 /100 | #58 | Exceptional 64.0% |
| Immigrants | Serbia | 99.6 /100 | #59 | Exceptional 63.8% |
| Immigrants | Kazakhstan | 99.5 /100 | #60 | Exceptional 63.6% |