Immigrants from Kuwait vs Asian College, 1 year or more
COMPARE
Immigrants from Kuwait
Asian
College, 1 year or more
College, 1 year or more Comparison
Immigrants from Kuwait
Asians
65.0%
COLLEGE, 1 YEAR OR MORE
99.9/ 100
METRIC RATING
40th/ 347
METRIC RANK
64.2%
COLLEGE, 1 YEAR OR MORE
99.8/ 100
METRIC RATING
53rd/ 347
METRIC RANK
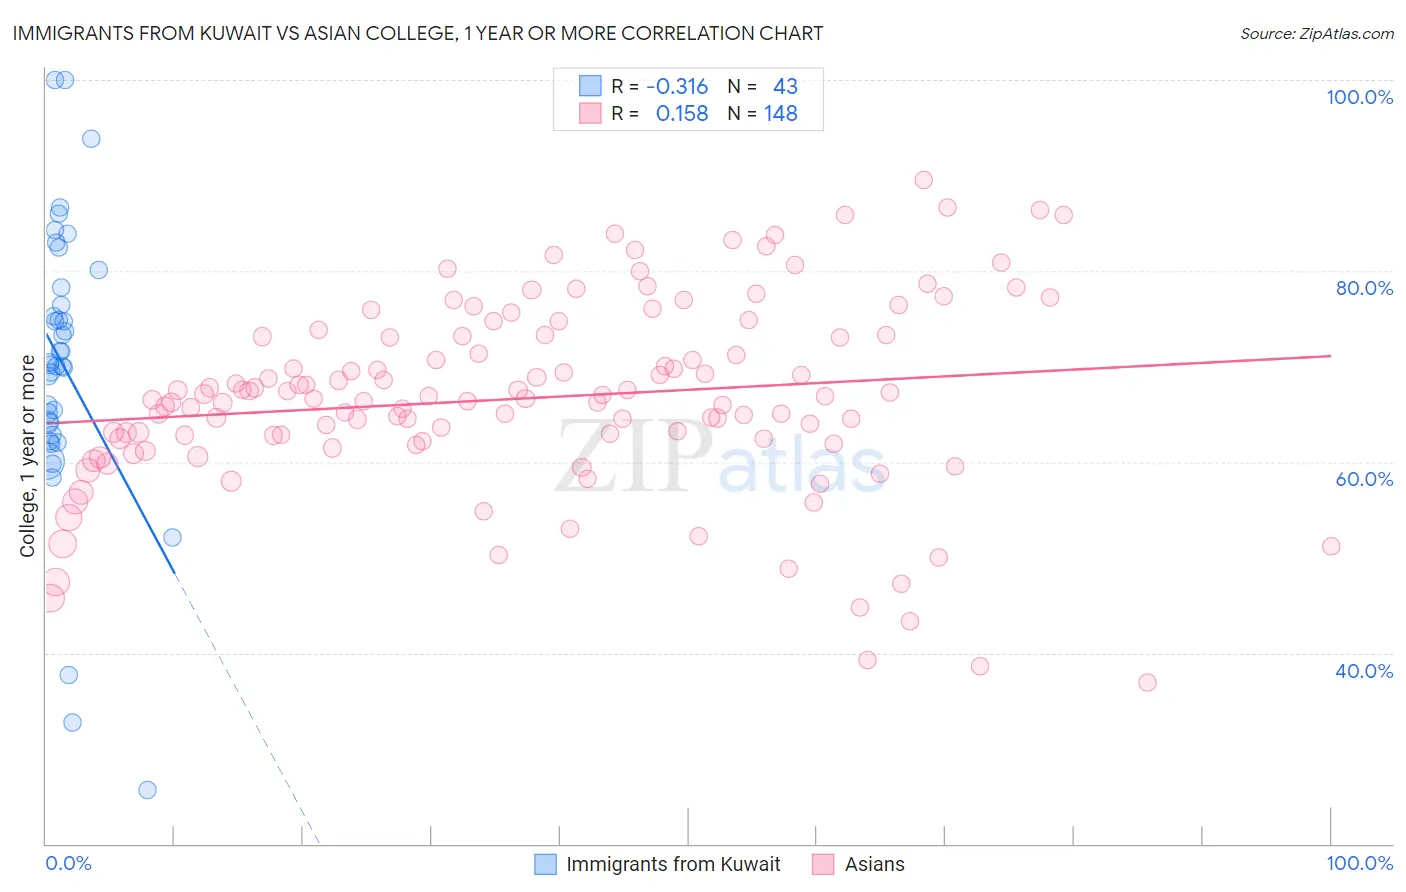
Immigrants from Kuwait vs Asian College, 1 year or more Correlation Chart
The statistical analysis conducted on geographies consisting of 136,917,085 people shows a mild negative correlation between the proportion of Immigrants from Kuwait and percentage of population with at least college, 1 year or more education in the United States with a correlation coefficient (R) of -0.316 and weighted average of 65.0%. Similarly, the statistical analysis conducted on geographies consisting of 550,911,104 people shows a poor positive correlation between the proportion of Asians and percentage of population with at least college, 1 year or more education in the United States with a correlation coefficient (R) of 0.158 and weighted average of 64.2%, a difference of 1.2%.
College, 1 year or more Correlation Summary
| Measurement | Immigrants from Kuwait | Asian |
| Minimum | 25.7% | 36.8% |
| Maximum | 100.0% | 89.5% |
| Range | 74.3% | 52.7% |
| Mean | 70.1% | 66.7% |
| Median | 70.2% | 66.6% |
| Interquartile 25% (IQ1) | 62.8% | 62.3% |
| Interquartile 75% (IQ3) | 78.3% | 73.1% |
| Interquartile Range (IQR) | 15.4% | 10.9% |
| Standard Deviation (Sample) | 14.9% | 10.0% |
| Standard Deviation (Population) | 14.8% | 10.0% |
Demographics Similar to Immigrants from Kuwait and Asians by College, 1 year or more
In terms of college, 1 year or more, the demographic groups most similar to Immigrants from Kuwait are Estonian (65.0%, a difference of 0.060%), Immigrants from Saudi Arabia (65.0%, a difference of 0.13%), Mongolian (64.8%, a difference of 0.20%), Immigrants from Latvia (64.8%, a difference of 0.21%), and Russian (65.1%, a difference of 0.28%). Similarly, the demographic groups most similar to Asians are Immigrants from Netherlands (64.2%, a difference of 0.020%), Zimbabwean (64.2%, a difference of 0.030%), Immigrants from Belarus (64.1%, a difference of 0.15%), Immigrants from Czechoslovakia (64.1%, a difference of 0.17%), and Immigrants from Malaysia (64.3%, a difference of 0.18%).
| Demographics | Rating | Rank | College, 1 year or more |
| Immigrants | South Africa | 99.9 /100 | #36 | Exceptional 65.1% |
| Russians | 99.9 /100 | #37 | Exceptional 65.1% |
| Immigrants | Saudi Arabia | 99.9 /100 | #38 | Exceptional 65.0% |
| Estonians | 99.9 /100 | #39 | Exceptional 65.0% |
| Immigrants | Kuwait | 99.9 /100 | #40 | Exceptional 65.0% |
| Mongolians | 99.9 /100 | #41 | Exceptional 64.8% |
| Immigrants | Latvia | 99.9 /100 | #42 | Exceptional 64.8% |
| Immigrants | Russia | 99.9 /100 | #43 | Exceptional 64.7% |
| Immigrants | Norway | 99.9 /100 | #44 | Exceptional 64.7% |
| Immigrants | Lithuania | 99.9 /100 | #45 | Exceptional 64.6% |
| Bhutanese | 99.9 /100 | #46 | Exceptional 64.6% |
| Australians | 99.9 /100 | #47 | Exceptional 64.6% |
| Immigrants | Bulgaria | 99.9 /100 | #48 | Exceptional 64.6% |
| New Zealanders | 99.9 /100 | #49 | Exceptional 64.6% |
| Immigrants | Austria | 99.8 /100 | #50 | Exceptional 64.4% |
| Immigrants | Malaysia | 99.8 /100 | #51 | Exceptional 64.3% |
| Immigrants | Netherlands | 99.8 /100 | #52 | Exceptional 64.2% |
| Asians | 99.8 /100 | #53 | Exceptional 64.2% |
| Zimbabweans | 99.8 /100 | #54 | Exceptional 64.2% |
| Immigrants | Belarus | 99.7 /100 | #55 | Exceptional 64.1% |
| Immigrants | Czechoslovakia | 99.7 /100 | #56 | Exceptional 64.1% |