Immigrants from Russia vs Asian College, 1 year or more
COMPARE
Immigrants from Russia
Asian
College, 1 year or more
College, 1 year or more Comparison
Immigrants from Russia
Asians
64.7%
COLLEGE, 1 YEAR OR MORE
99.9/ 100
METRIC RATING
43rd/ 347
METRIC RANK
64.2%
COLLEGE, 1 YEAR OR MORE
99.8/ 100
METRIC RATING
53rd/ 347
METRIC RANK
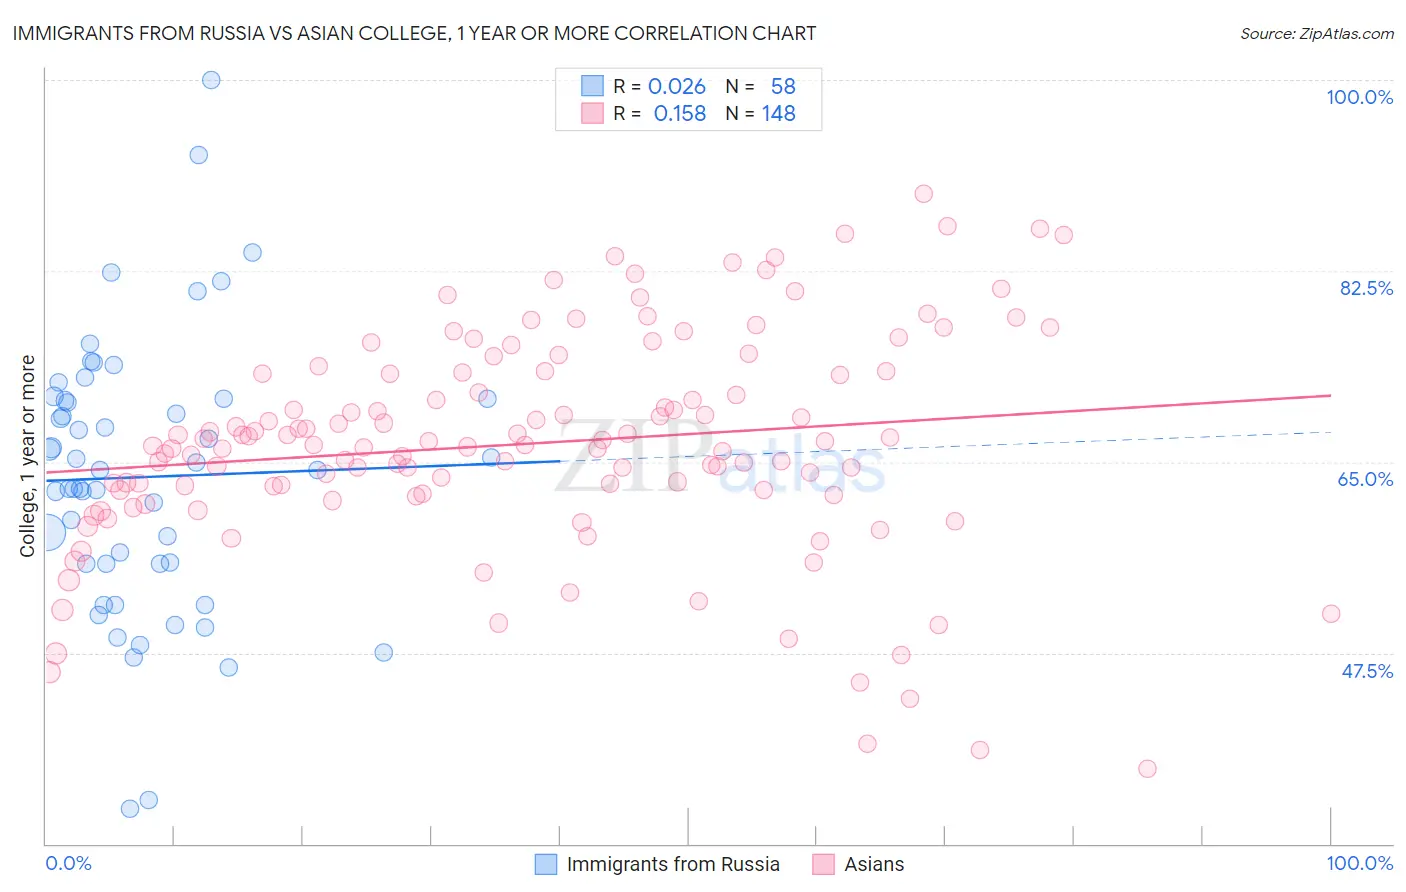
Immigrants from Russia vs Asian College, 1 year or more Correlation Chart
The statistical analysis conducted on geographies consisting of 347,945,922 people shows no correlation between the proportion of Immigrants from Russia and percentage of population with at least college, 1 year or more education in the United States with a correlation coefficient (R) of 0.026 and weighted average of 64.7%. Similarly, the statistical analysis conducted on geographies consisting of 550,911,104 people shows a poor positive correlation between the proportion of Asians and percentage of population with at least college, 1 year or more education in the United States with a correlation coefficient (R) of 0.158 and weighted average of 64.2%, a difference of 0.83%.
College, 1 year or more Correlation Summary
| Measurement | Immigrants from Russia | Asian |
| Minimum | 33.2% | 36.8% |
| Maximum | 100.0% | 89.5% |
| Range | 66.8% | 52.7% |
| Mean | 63.6% | 66.7% |
| Median | 64.2% | 66.6% |
| Interquartile 25% (IQ1) | 55.7% | 62.3% |
| Interquartile 75% (IQ3) | 70.8% | 73.1% |
| Interquartile Range (IQR) | 15.1% | 10.9% |
| Standard Deviation (Sample) | 12.6% | 10.0% |
| Standard Deviation (Population) | 12.5% | 10.0% |
Demographics Similar to Immigrants from Russia and Asians by College, 1 year or more
In terms of college, 1 year or more, the demographic groups most similar to Immigrants from Russia are Immigrants from Norway (64.7%, a difference of 0.020%), Immigrants from Latvia (64.8%, a difference of 0.12%), Mongolian (64.8%, a difference of 0.13%), Immigrants from Lithuania (64.6%, a difference of 0.19%), and Bhutanese (64.6%, a difference of 0.20%). Similarly, the demographic groups most similar to Asians are Immigrants from Netherlands (64.2%, a difference of 0.020%), Zimbabwean (64.2%, a difference of 0.030%), Immigrants from Belarus (64.1%, a difference of 0.15%), Immigrants from Czechoslovakia (64.1%, a difference of 0.17%), and Immigrants from Malaysia (64.3%, a difference of 0.18%).
| Demographics | Rating | Rank | College, 1 year or more |
| Immigrants | Saudi Arabia | 99.9 /100 | #38 | Exceptional 65.0% |
| Estonians | 99.9 /100 | #39 | Exceptional 65.0% |
| Immigrants | Kuwait | 99.9 /100 | #40 | Exceptional 65.0% |
| Mongolians | 99.9 /100 | #41 | Exceptional 64.8% |
| Immigrants | Latvia | 99.9 /100 | #42 | Exceptional 64.8% |
| Immigrants | Russia | 99.9 /100 | #43 | Exceptional 64.7% |
| Immigrants | Norway | 99.9 /100 | #44 | Exceptional 64.7% |
| Immigrants | Lithuania | 99.9 /100 | #45 | Exceptional 64.6% |
| Bhutanese | 99.9 /100 | #46 | Exceptional 64.6% |
| Australians | 99.9 /100 | #47 | Exceptional 64.6% |
| Immigrants | Bulgaria | 99.9 /100 | #48 | Exceptional 64.6% |
| New Zealanders | 99.9 /100 | #49 | Exceptional 64.6% |
| Immigrants | Austria | 99.8 /100 | #50 | Exceptional 64.4% |
| Immigrants | Malaysia | 99.8 /100 | #51 | Exceptional 64.3% |
| Immigrants | Netherlands | 99.8 /100 | #52 | Exceptional 64.2% |
| Asians | 99.8 /100 | #53 | Exceptional 64.2% |
| Zimbabweans | 99.8 /100 | #54 | Exceptional 64.2% |
| Immigrants | Belarus | 99.7 /100 | #55 | Exceptional 64.1% |
| Immigrants | Czechoslovakia | 99.7 /100 | #56 | Exceptional 64.1% |
| South Africans | 99.7 /100 | #57 | Exceptional 64.1% |
| Immigrants | Asia | 99.7 /100 | #58 | Exceptional 64.0% |