Guatemalan vs Chinese College, 1 year or more
COMPARE
Guatemalan
Chinese
College, 1 year or more
College, 1 year or more Comparison
Guatemalans
Chinese
51.2%
COLLEGE, 1 YEAR OR MORE
0.0/ 100
METRIC RATING
315th/ 347
METRIC RANK
62.2%
COLLEGE, 1 YEAR OR MORE
97.2/ 100
METRIC RATING
96th/ 347
METRIC RANK
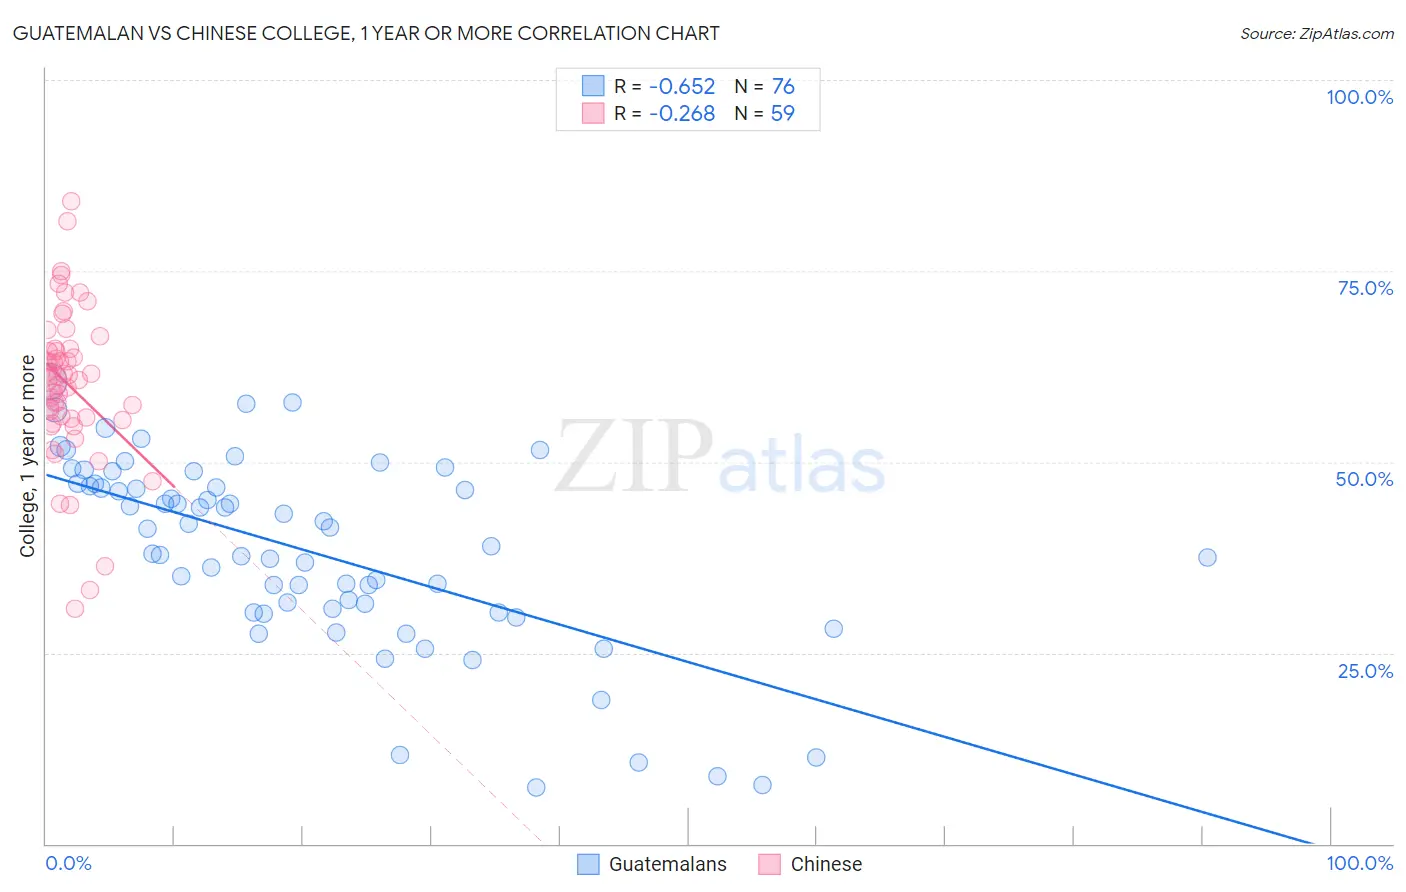
Guatemalan vs Chinese College, 1 year or more Correlation Chart
The statistical analysis conducted on geographies consisting of 409,563,742 people shows a significant negative correlation between the proportion of Guatemalans and percentage of population with at least college, 1 year or more education in the United States with a correlation coefficient (R) of -0.652 and weighted average of 51.2%. Similarly, the statistical analysis conducted on geographies consisting of 64,809,883 people shows a weak negative correlation between the proportion of Chinese and percentage of population with at least college, 1 year or more education in the United States with a correlation coefficient (R) of -0.268 and weighted average of 62.2%, a difference of 21.5%.
College, 1 year or more Correlation Summary
| Measurement | Guatemalan | Chinese |
| Minimum | 7.4% | 30.8% |
| Maximum | 60.6% | 84.1% |
| Range | 53.2% | 53.3% |
| Mean | 38.2% | 60.1% |
| Median | 40.1% | 61.2% |
| Interquartile 25% (IQ1) | 30.6% | 55.6% |
| Interquartile 75% (IQ3) | 47.0% | 64.8% |
| Interquartile Range (IQR) | 16.5% | 9.1% |
| Standard Deviation (Sample) | 12.5% | 10.0% |
| Standard Deviation (Population) | 12.4% | 10.0% |
Similar Demographics by College, 1 year or more
Demographics Similar to Guatemalans by College, 1 year or more
In terms of college, 1 year or more, the demographic groups most similar to Guatemalans are Cajun (51.2%, a difference of 0.070%), Hispanic or Latino (51.1%, a difference of 0.16%), Fijian (51.3%, a difference of 0.23%), Immigrants from Honduras (51.0%, a difference of 0.29%), and Immigrants from El Salvador (51.0%, a difference of 0.38%).
| Demographics | Rating | Rank | College, 1 year or more |
| Salvadorans | 0.0 /100 | #308 | Tragic 51.8% |
| Apache | 0.0 /100 | #309 | Tragic 51.8% |
| Hondurans | 0.0 /100 | #310 | Tragic 51.6% |
| Immigrants | Haiti | 0.0 /100 | #311 | Tragic 51.5% |
| Pueblo | 0.0 /100 | #312 | Tragic 51.5% |
| Immigrants | Caribbean | 0.0 /100 | #313 | Tragic 51.4% |
| Fijians | 0.0 /100 | #314 | Tragic 51.3% |
| Guatemalans | 0.0 /100 | #315 | Tragic 51.2% |
| Cajuns | 0.0 /100 | #316 | Tragic 51.2% |
| Hispanics or Latinos | 0.0 /100 | #317 | Tragic 51.1% |
| Immigrants | Honduras | 0.0 /100 | #318 | Tragic 51.0% |
| Immigrants | El Salvador | 0.0 /100 | #319 | Tragic 51.0% |
| Kiowa | 0.0 /100 | #320 | Tragic 51.0% |
| Hopi | 0.0 /100 | #321 | Tragic 50.9% |
| Navajo | 0.0 /100 | #322 | Tragic 50.8% |
Demographics Similar to Chinese by College, 1 year or more
In terms of college, 1 year or more, the demographic groups most similar to Chinese are Jordanian (62.2%, a difference of 0.010%), Carpatho Rusyn (62.2%, a difference of 0.010%), Croatian (62.2%, a difference of 0.010%), British (62.3%, a difference of 0.12%), and Icelander (62.1%, a difference of 0.17%).
| Demographics | Rating | Rank | College, 1 year or more |
| Immigrants | Ethiopia | 98.2 /100 | #89 | Exceptional 62.6% |
| Immigrants | Western Asia | 97.9 /100 | #90 | Exceptional 62.5% |
| Immigrants | Eastern Europe | 97.8 /100 | #91 | Exceptional 62.4% |
| Immigrants | Egypt | 97.8 /100 | #92 | Exceptional 62.4% |
| Romanians | 97.7 /100 | #93 | Exceptional 62.4% |
| Immigrants | Croatia | 97.6 /100 | #94 | Exceptional 62.3% |
| British | 97.4 /100 | #95 | Exceptional 62.3% |
| Chinese | 97.2 /100 | #96 | Exceptional 62.2% |
| Jordanians | 97.2 /100 | #97 | Exceptional 62.2% |
| Carpatho Rusyns | 97.2 /100 | #98 | Exceptional 62.2% |
| Croatians | 97.1 /100 | #99 | Exceptional 62.2% |
| Icelanders | 96.8 /100 | #100 | Exceptional 62.1% |
| Swedes | 96.8 /100 | #101 | Exceptional 62.1% |
| Luxembourgers | 96.7 /100 | #102 | Exceptional 62.1% |
| Afghans | 96.4 /100 | #103 | Exceptional 62.0% |