Guamanian/Chamorro vs Guatemalan Median Household Income
COMPARE
Guamanian/Chamorro
Guatemalan
Median Household Income
Median Household Income Comparison
Guamanians/Chamorros
Guatemalans
$86,255
MEDIAN HOUSEHOLD INCOME
67.7/ 100
METRIC RATING
162nd/ 347
METRIC RANK
$75,961
MEDIAN HOUSEHOLD INCOME
0.3/ 100
METRIC RATING
264th/ 347
METRIC RANK
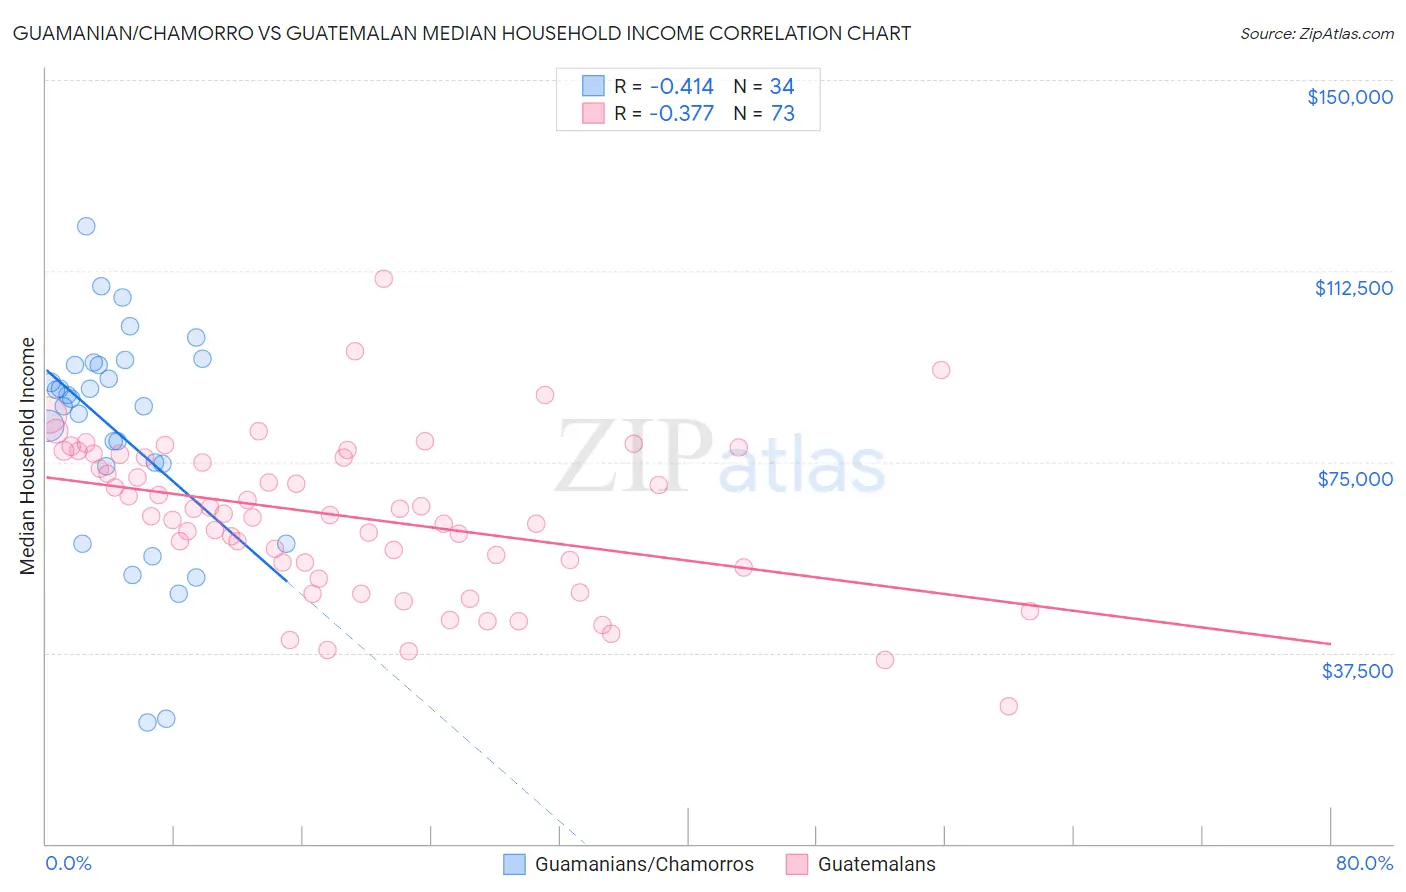
Guamanian/Chamorro vs Guatemalan Median Household Income Correlation Chart
The statistical analysis conducted on geographies consisting of 221,863,113 people shows a moderate negative correlation between the proportion of Guamanians/Chamorros and median household income in the United States with a correlation coefficient (R) of -0.414 and weighted average of $86,255. Similarly, the statistical analysis conducted on geographies consisting of 409,198,651 people shows a mild negative correlation between the proportion of Guatemalans and median household income in the United States with a correlation coefficient (R) of -0.377 and weighted average of $75,961, a difference of 13.6%.
Median Household Income Correlation Summary
| Measurement | Guamanian/Chamorro | Guatemalan |
| Minimum | $23,750 | $26,979 |
| Maximum | $121,240 | $111,004 |
| Range | $97,490 | $84,025 |
| Mean | $80,405 | $64,179 |
| Median | $86,640 | $64,652 |
| Interquartile 25% (IQ1) | $74,171 | $54,709 |
| Interquartile 75% (IQ3) | $94,093 | $76,221 |
| Interquartile Range (IQR) | $19,922 | $21,512 |
| Standard Deviation (Sample) | $22,128 | $15,411 |
| Standard Deviation (Population) | $21,800 | $15,305 |
Similar Demographics by Median Household Income
Demographics Similar to Guamanians/Chamorros by Median Household Income
In terms of median household income, the demographic groups most similar to Guamanians/Chamorros are Czech ($86,164, a difference of 0.11%), Irish ($86,145, a difference of 0.13%), Slavic ($86,398, a difference of 0.17%), Luxembourger ($86,418, a difference of 0.19%), and Immigrants from Uzbekistan ($86,425, a difference of 0.20%).
| Demographics | Rating | Rank | Median Household Income |
| Carpatho Rusyns | 72.8 /100 | #155 | Good $86,635 |
| Immigrants | Albania | 71.5 /100 | #156 | Good $86,534 |
| Samoans | 71.0 /100 | #157 | Good $86,498 |
| Moroccans | 70.6 /100 | #158 | Good $86,468 |
| Immigrants | Uzbekistan | 70.1 /100 | #159 | Good $86,425 |
| Luxembourgers | 70.0 /100 | #160 | Good $86,418 |
| Slavs | 69.7 /100 | #161 | Good $86,398 |
| Guamanians/Chamorros | 67.7 /100 | #162 | Good $86,255 |
| Czechs | 66.4 /100 | #163 | Good $86,164 |
| Irish | 66.2 /100 | #164 | Good $86,145 |
| Norwegians | 65.3 /100 | #165 | Good $86,084 |
| Scandinavians | 65.1 /100 | #166 | Good $86,073 |
| Immigrants | Immigrants | 61.3 /100 | #167 | Good $85,818 |
| Icelanders | 61.0 /100 | #168 | Good $85,797 |
| Colombians | 59.7 /100 | #169 | Average $85,716 |
Demographics Similar to Guatemalans by Median Household Income
In terms of median household income, the demographic groups most similar to Guatemalans are Immigrants from Belize ($75,938, a difference of 0.030%), American ($75,932, a difference of 0.040%), German Russian ($75,856, a difference of 0.14%), Immigrants from Jamaica ($75,851, a difference of 0.15%), and Cape Verdean ($75,848, a difference of 0.15%).
| Demographics | Rating | Rank | Median Household Income |
| Immigrants | Senegal | 0.5 /100 | #257 | Tragic $76,915 |
| Immigrants | Nicaragua | 0.5 /100 | #258 | Tragic $76,784 |
| Spanish American Indians | 0.4 /100 | #259 | Tragic $76,670 |
| Jamaicans | 0.4 /100 | #260 | Tragic $76,583 |
| Immigrants | Grenada | 0.4 /100 | #261 | Tragic $76,517 |
| French American Indians | 0.4 /100 | #262 | Tragic $76,387 |
| Alaskan Athabascans | 0.4 /100 | #263 | Tragic $76,383 |
| Guatemalans | 0.3 /100 | #264 | Tragic $75,961 |
| Immigrants | Belize | 0.3 /100 | #265 | Tragic $75,938 |
| Americans | 0.3 /100 | #266 | Tragic $75,932 |
| German Russians | 0.3 /100 | #267 | Tragic $75,856 |
| Immigrants | Jamaica | 0.3 /100 | #268 | Tragic $75,851 |
| Cape Verdeans | 0.3 /100 | #269 | Tragic $75,848 |
| Hmong | 0.3 /100 | #270 | Tragic $75,839 |
| Pennsylvania Germans | 0.3 /100 | #271 | Tragic $75,814 |