Ghanaian vs Immigrants from Jordan College, Under 1 year
COMPARE
Ghanaian
Immigrants from Jordan
College, Under 1 year
College, Under 1 year Comparison
Ghanaians
Immigrants from Jordan
63.9%
COLLEGE, UNDER 1 YEAR
11.2/ 100
METRIC RATING
210th/ 347
METRIC RANK
67.3%
COLLEGE, UNDER 1 YEAR
92.8/ 100
METRIC RATING
122nd/ 347
METRIC RANK
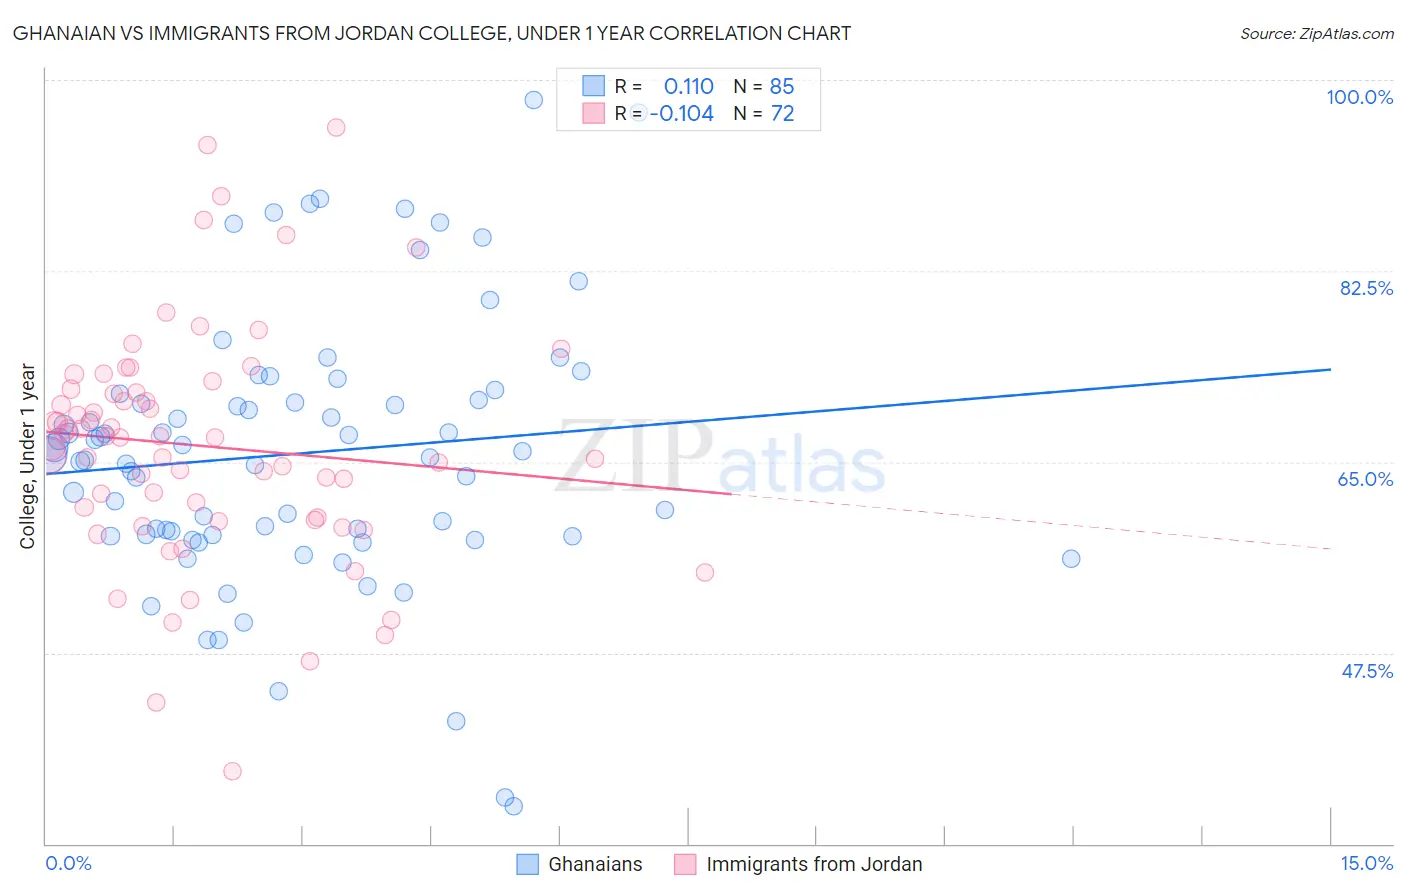
Ghanaian vs Immigrants from Jordan College, Under 1 year Correlation Chart
The statistical analysis conducted on geographies consisting of 190,712,650 people shows a poor positive correlation between the proportion of Ghanaians and percentage of population with at least college, under 1 year education in the United States with a correlation coefficient (R) of 0.110 and weighted average of 63.9%. Similarly, the statistical analysis conducted on geographies consisting of 181,278,834 people shows a poor negative correlation between the proportion of Immigrants from Jordan and percentage of population with at least college, under 1 year education in the United States with a correlation coefficient (R) of -0.104 and weighted average of 67.3%, a difference of 5.2%.
College, Under 1 year Correlation Summary
| Measurement | Ghanaian | Immigrants from Jordan |
| Minimum | 33.5% | 36.7% |
| Maximum | 98.2% | 95.6% |
| Range | 64.7% | 59.0% |
| Mean | 65.8% | 66.5% |
| Median | 65.7% | 67.2% |
| Interquartile 25% (IQ1) | 58.3% | 59.8% |
| Interquartile 75% (IQ3) | 71.0% | 71.5% |
| Interquartile Range (IQR) | 12.7% | 11.7% |
| Standard Deviation (Sample) | 12.3% | 10.8% |
| Standard Deviation (Population) | 12.3% | 10.7% |
Similar Demographics by College, Under 1 year
Demographics Similar to Ghanaians by College, Under 1 year
In terms of college, under 1 year, the demographic groups most similar to Ghanaians are Puget Sound Salish (63.9%, a difference of 0.010%), Native Hawaiian (63.9%, a difference of 0.070%), Immigrants from Middle Africa (63.9%, a difference of 0.080%), Immigrants from Vietnam (64.0%, a difference of 0.10%), and Colombian (64.0%, a difference of 0.13%).
| Demographics | Rating | Rank | College, Under 1 year |
| Uruguayans | 15.6 /100 | #203 | Poor 64.2% |
| Immigrants | Zaire | 14.6 /100 | #204 | Poor 64.1% |
| Peruvians | 13.7 /100 | #205 | Poor 64.1% |
| Whites/Caucasians | 12.8 /100 | #206 | Poor 64.0% |
| Colombians | 12.4 /100 | #207 | Poor 64.0% |
| Immigrants | Vietnam | 12.1 /100 | #208 | Poor 64.0% |
| Puget Sound Salish | 11.3 /100 | #209 | Poor 63.9% |
| Ghanaians | 11.2 /100 | #210 | Poor 63.9% |
| Native Hawaiians | 10.6 /100 | #211 | Poor 63.9% |
| Immigrants | Middle Africa | 10.5 /100 | #212 | Poor 63.9% |
| Immigrants | South America | 9.1 /100 | #213 | Tragic 63.8% |
| Immigrants | Nigeria | 8.8 /100 | #214 | Tragic 63.7% |
| Senegalese | 7.7 /100 | #215 | Tragic 63.6% |
| Hmong | 6.8 /100 | #216 | Tragic 63.5% |
| Immigrants | Uruguay | 5.8 /100 | #217 | Tragic 63.4% |
Demographics Similar to Immigrants from Jordan by College, Under 1 year
In terms of college, under 1 year, the demographic groups most similar to Immigrants from Jordan are Immigrants from Northern Africa (67.2%, a difference of 0.020%), Arab (67.2%, a difference of 0.030%), Slovene (67.3%, a difference of 0.090%), Italian (67.2%, a difference of 0.15%), and Serbian (67.4%, a difference of 0.18%).
| Demographics | Rating | Rank | College, Under 1 year |
| Basques | 95.2 /100 | #115 | Exceptional 67.6% |
| Immigrants | Nepal | 94.9 /100 | #116 | Exceptional 67.5% |
| Pakistanis | 94.8 /100 | #117 | Exceptional 67.5% |
| Immigrants | Ukraine | 94.7 /100 | #118 | Exceptional 67.5% |
| Lebanese | 94.6 /100 | #119 | Exceptional 67.5% |
| Serbians | 93.9 /100 | #120 | Exceptional 67.4% |
| Slovenes | 93.3 /100 | #121 | Exceptional 67.3% |
| Immigrants | Jordan | 92.8 /100 | #122 | Exceptional 67.3% |
| Immigrants | Northern Africa | 92.7 /100 | #123 | Exceptional 67.2% |
| Arabs | 92.6 /100 | #124 | Exceptional 67.2% |
| Italians | 91.8 /100 | #125 | Exceptional 67.2% |
| Alsatians | 91.3 /100 | #126 | Exceptional 67.1% |
| Czechs | 90.8 /100 | #127 | Exceptional 67.1% |
| Scottish | 90.2 /100 | #128 | Exceptional 67.0% |
| Immigrants | Eastern Africa | 89.5 /100 | #129 | Excellent 67.0% |