Immigrants from Ethiopia vs Immigrants from Jordan College, Under 1 year
COMPARE
Immigrants from Ethiopia
Immigrants from Jordan
College, Under 1 year
College, Under 1 year Comparison
Immigrants from Ethiopia
Immigrants from Jordan
68.0%
COLLEGE, UNDER 1 YEAR
97.3/ 100
METRIC RATING
97th/ 347
METRIC RANK
67.3%
COLLEGE, UNDER 1 YEAR
92.8/ 100
METRIC RATING
122nd/ 347
METRIC RANK
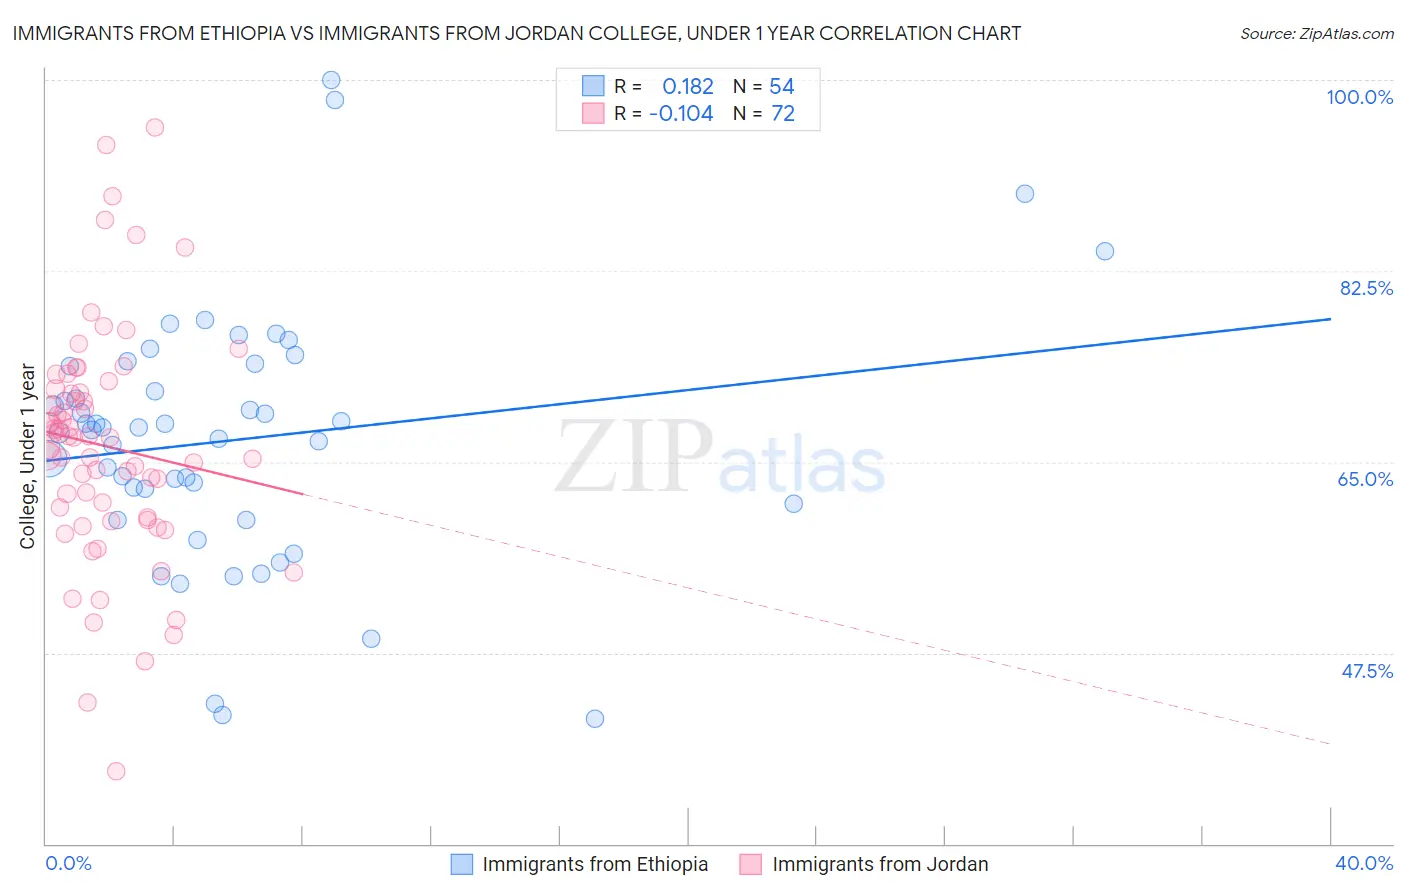
Immigrants from Ethiopia vs Immigrants from Jordan College, Under 1 year Correlation Chart
The statistical analysis conducted on geographies consisting of 211,551,932 people shows a poor positive correlation between the proportion of Immigrants from Ethiopia and percentage of population with at least college, under 1 year education in the United States with a correlation coefficient (R) of 0.182 and weighted average of 68.0%. Similarly, the statistical analysis conducted on geographies consisting of 181,278,834 people shows a poor negative correlation between the proportion of Immigrants from Jordan and percentage of population with at least college, under 1 year education in the United States with a correlation coefficient (R) of -0.104 and weighted average of 67.3%, a difference of 1.1%.
College, Under 1 year Correlation Summary
| Measurement | Immigrants from Ethiopia | Immigrants from Jordan |
| Minimum | 41.4% | 36.7% |
| Maximum | 100.0% | 95.6% |
| Range | 58.6% | 59.0% |
| Mean | 67.0% | 66.5% |
| Median | 68.0% | 67.2% |
| Interquartile 25% (IQ1) | 61.1% | 59.8% |
| Interquartile 75% (IQ3) | 73.8% | 71.5% |
| Interquartile Range (IQR) | 12.6% | 11.7% |
| Standard Deviation (Sample) | 11.6% | 10.8% |
| Standard Deviation (Population) | 11.5% | 10.7% |
Similar Demographics by College, Under 1 year
Demographics Similar to Immigrants from Ethiopia by College, Under 1 year
In terms of college, under 1 year, the demographic groups most similar to Immigrants from Ethiopia are Jordanian (68.0%, a difference of 0.030%), Immigrants from Pakistan (68.0%, a difference of 0.060%), Paraguayan (67.9%, a difference of 0.10%), Immigrants from Bolivia (67.9%, a difference of 0.12%), and Immigrants from Argentina (67.9%, a difference of 0.13%).
| Demographics | Rating | Rank | College, Under 1 year |
| Icelanders | 98.1 /100 | #90 | Exceptional 68.3% |
| Europeans | 98.1 /100 | #91 | Exceptional 68.2% |
| Luxembourgers | 98.1 /100 | #92 | Exceptional 68.2% |
| Romanians | 97.9 /100 | #93 | Exceptional 68.2% |
| Armenians | 97.7 /100 | #94 | Exceptional 68.1% |
| Immigrants | Pakistan | 97.5 /100 | #95 | Exceptional 68.0% |
| Jordanians | 97.4 /100 | #96 | Exceptional 68.0% |
| Immigrants | Ethiopia | 97.3 /100 | #97 | Exceptional 68.0% |
| Paraguayans | 97.1 /100 | #98 | Exceptional 67.9% |
| Immigrants | Bolivia | 97.0 /100 | #99 | Exceptional 67.9% |
| Immigrants | Argentina | 97.0 /100 | #100 | Exceptional 67.9% |
| Immigrants | Eastern Europe | 96.9 /100 | #101 | Exceptional 67.9% |
| Palestinians | 96.9 /100 | #102 | Exceptional 67.9% |
| Carpatho Rusyns | 96.8 /100 | #103 | Exceptional 67.9% |
| Immigrants | Western Asia | 96.6 /100 | #104 | Exceptional 67.8% |
Demographics Similar to Immigrants from Jordan by College, Under 1 year
In terms of college, under 1 year, the demographic groups most similar to Immigrants from Jordan are Immigrants from Northern Africa (67.2%, a difference of 0.020%), Arab (67.2%, a difference of 0.030%), Slovene (67.3%, a difference of 0.090%), Italian (67.2%, a difference of 0.15%), and Serbian (67.4%, a difference of 0.18%).
| Demographics | Rating | Rank | College, Under 1 year |
| Basques | 95.2 /100 | #115 | Exceptional 67.6% |
| Immigrants | Nepal | 94.9 /100 | #116 | Exceptional 67.5% |
| Pakistanis | 94.8 /100 | #117 | Exceptional 67.5% |
| Immigrants | Ukraine | 94.7 /100 | #118 | Exceptional 67.5% |
| Lebanese | 94.6 /100 | #119 | Exceptional 67.5% |
| Serbians | 93.9 /100 | #120 | Exceptional 67.4% |
| Slovenes | 93.3 /100 | #121 | Exceptional 67.3% |
| Immigrants | Jordan | 92.8 /100 | #122 | Exceptional 67.3% |
| Immigrants | Northern Africa | 92.7 /100 | #123 | Exceptional 67.2% |
| Arabs | 92.6 /100 | #124 | Exceptional 67.2% |
| Italians | 91.8 /100 | #125 | Exceptional 67.2% |
| Alsatians | 91.3 /100 | #126 | Exceptional 67.1% |
| Czechs | 90.8 /100 | #127 | Exceptional 67.1% |
| Scottish | 90.2 /100 | #128 | Exceptional 67.0% |
| Immigrants | Eastern Africa | 89.5 /100 | #129 | Excellent 67.0% |