Ghanaian vs Immigrants from Somalia College, Under 1 year
COMPARE
Ghanaian
Immigrants from Somalia
College, Under 1 year
College, Under 1 year Comparison
Ghanaians
Immigrants from Somalia
63.9%
COLLEGE, UNDER 1 YEAR
11.2/ 100
METRIC RATING
210th/ 347
METRIC RANK
65.6%
COLLEGE, UNDER 1 YEAR
56.4/ 100
METRIC RATING
167th/ 347
METRIC RANK
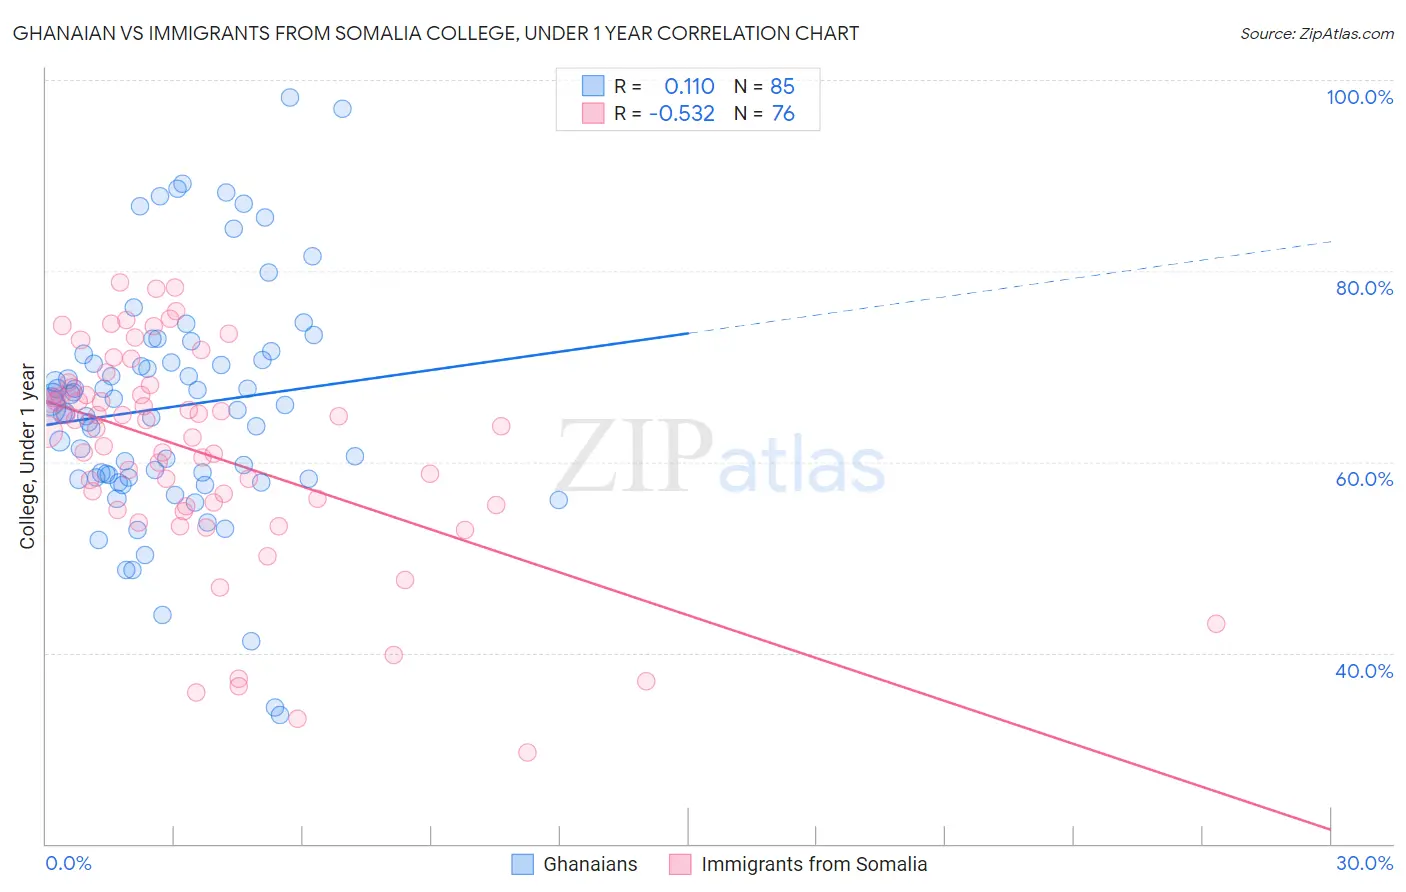
Ghanaian vs Immigrants from Somalia College, Under 1 year Correlation Chart
The statistical analysis conducted on geographies consisting of 190,712,650 people shows a poor positive correlation between the proportion of Ghanaians and percentage of population with at least college, under 1 year education in the United States with a correlation coefficient (R) of 0.110 and weighted average of 63.9%. Similarly, the statistical analysis conducted on geographies consisting of 92,111,755 people shows a substantial negative correlation between the proportion of Immigrants from Somalia and percentage of population with at least college, under 1 year education in the United States with a correlation coefficient (R) of -0.532 and weighted average of 65.6%, a difference of 2.6%.
College, Under 1 year Correlation Summary
| Measurement | Ghanaian | Immigrants from Somalia |
| Minimum | 33.5% | 29.5% |
| Maximum | 98.2% | 78.8% |
| Range | 64.7% | 49.3% |
| Mean | 65.8% | 60.9% |
| Median | 65.7% | 63.6% |
| Interquartile 25% (IQ1) | 58.3% | 55.4% |
| Interquartile 75% (IQ3) | 71.0% | 67.4% |
| Interquartile Range (IQR) | 12.7% | 12.0% |
| Standard Deviation (Sample) | 12.3% | 11.2% |
| Standard Deviation (Population) | 12.3% | 11.1% |
Similar Demographics by College, Under 1 year
Demographics Similar to Ghanaians by College, Under 1 year
In terms of college, under 1 year, the demographic groups most similar to Ghanaians are Puget Sound Salish (63.9%, a difference of 0.010%), Native Hawaiian (63.9%, a difference of 0.070%), Immigrants from Middle Africa (63.9%, a difference of 0.080%), Immigrants from Vietnam (64.0%, a difference of 0.10%), and Colombian (64.0%, a difference of 0.13%).
| Demographics | Rating | Rank | College, Under 1 year |
| Uruguayans | 15.6 /100 | #203 | Poor 64.2% |
| Immigrants | Zaire | 14.6 /100 | #204 | Poor 64.1% |
| Peruvians | 13.7 /100 | #205 | Poor 64.1% |
| Whites/Caucasians | 12.8 /100 | #206 | Poor 64.0% |
| Colombians | 12.4 /100 | #207 | Poor 64.0% |
| Immigrants | Vietnam | 12.1 /100 | #208 | Poor 64.0% |
| Puget Sound Salish | 11.3 /100 | #209 | Poor 63.9% |
| Ghanaians | 11.2 /100 | #210 | Poor 63.9% |
| Native Hawaiians | 10.6 /100 | #211 | Poor 63.9% |
| Immigrants | Middle Africa | 10.5 /100 | #212 | Poor 63.9% |
| Immigrants | South America | 9.1 /100 | #213 | Tragic 63.8% |
| Immigrants | Nigeria | 8.8 /100 | #214 | Tragic 63.7% |
| Senegalese | 7.7 /100 | #215 | Tragic 63.6% |
| Hmong | 6.8 /100 | #216 | Tragic 63.5% |
| Immigrants | Uruguay | 5.8 /100 | #217 | Tragic 63.4% |
Demographics Similar to Immigrants from Somalia by College, Under 1 year
In terms of college, under 1 year, the demographic groups most similar to Immigrants from Somalia are Moroccan (65.6%, a difference of 0.010%), Hungarian (65.6%, a difference of 0.020%), Yugoslavian (65.6%, a difference of 0.030%), German (65.6%, a difference of 0.030%), and Immigrants from Oceania (65.6%, a difference of 0.060%).
| Demographics | Rating | Rank | College, Under 1 year |
| Albanians | 66.1 /100 | #160 | Good 65.9% |
| Brazilians | 66.0 /100 | #161 | Good 65.9% |
| Koreans | 65.3 /100 | #162 | Good 65.9% |
| Somalis | 62.7 /100 | #163 | Good 65.8% |
| Czechoslovakians | 62.6 /100 | #164 | Good 65.8% |
| Immigrants | Uzbekistan | 61.6 /100 | #165 | Good 65.8% |
| Moroccans | 56.7 /100 | #166 | Average 65.6% |
| Immigrants | Somalia | 56.4 /100 | #167 | Average 65.6% |
| Hungarians | 55.9 /100 | #168 | Average 65.6% |
| Yugoslavians | 55.7 /100 | #169 | Average 65.6% |
| Germans | 55.7 /100 | #170 | Average 65.6% |
| Immigrants | Oceania | 55.0 /100 | #171 | Average 65.6% |
| South American Indians | 54.4 /100 | #172 | Average 65.5% |
| Swiss | 53.9 /100 | #173 | Average 65.5% |
| Immigrants | Bosnia and Herzegovina | 50.0 /100 | #174 | Average 65.4% |