Seminole vs Immigrants from Jordan College, Under 1 year
COMPARE
Seminole
Immigrants from Jordan
College, Under 1 year
College, Under 1 year Comparison
Seminole
Immigrants from Jordan
59.1%
COLLEGE, UNDER 1 YEAR
0.0/ 100
METRIC RATING
293rd/ 347
METRIC RANK
67.3%
COLLEGE, UNDER 1 YEAR
92.8/ 100
METRIC RATING
122nd/ 347
METRIC RANK
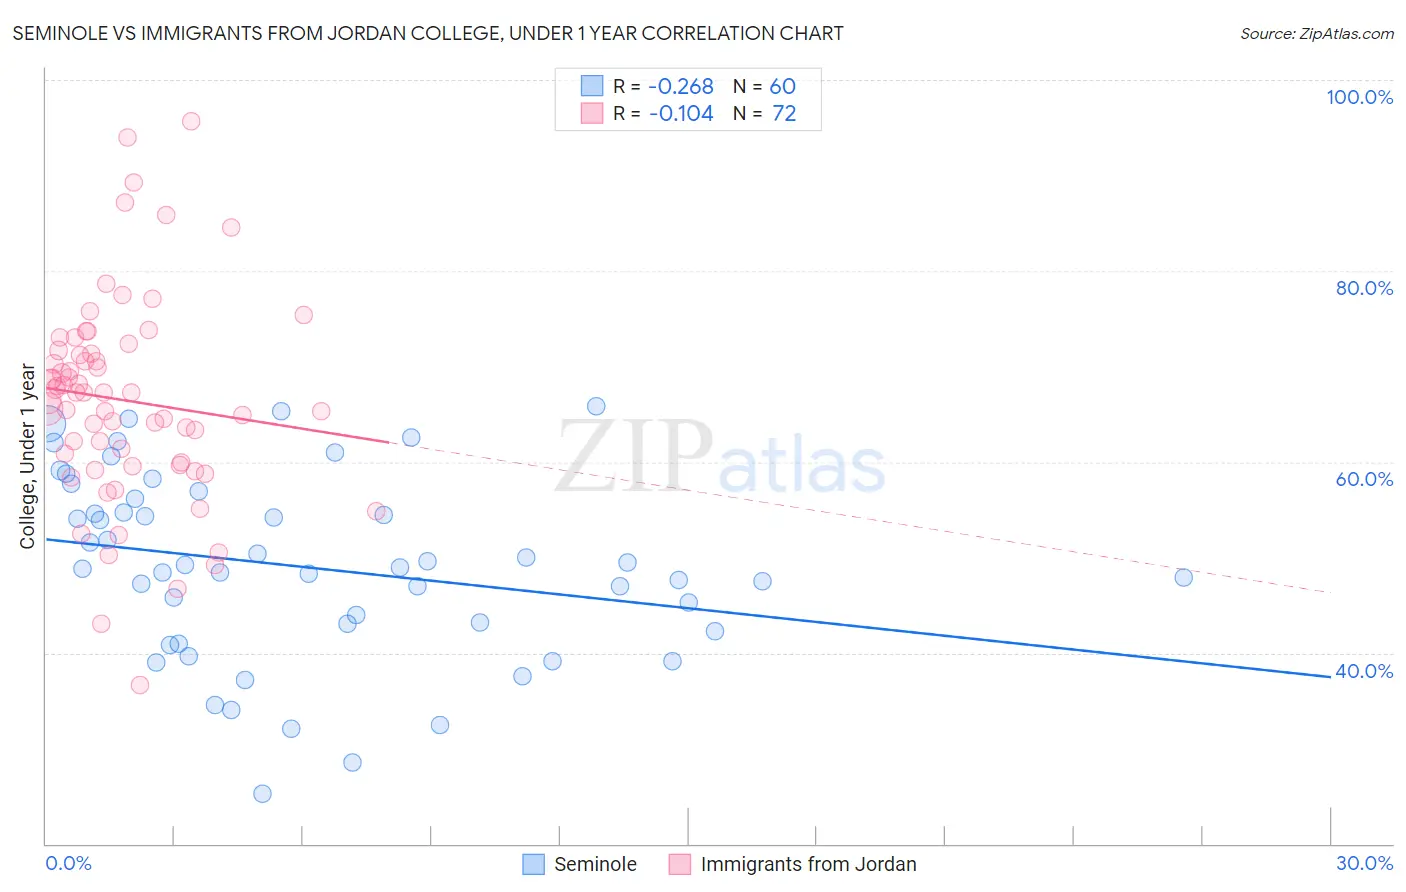
Seminole vs Immigrants from Jordan College, Under 1 year Correlation Chart
The statistical analysis conducted on geographies consisting of 118,314,121 people shows a weak negative correlation between the proportion of Seminole and percentage of population with at least college, under 1 year education in the United States with a correlation coefficient (R) of -0.268 and weighted average of 59.1%. Similarly, the statistical analysis conducted on geographies consisting of 181,278,834 people shows a poor negative correlation between the proportion of Immigrants from Jordan and percentage of population with at least college, under 1 year education in the United States with a correlation coefficient (R) of -0.104 and weighted average of 67.3%, a difference of 13.7%.
College, Under 1 year Correlation Summary
| Measurement | Seminole | Immigrants from Jordan |
| Minimum | 25.3% | 36.7% |
| Maximum | 65.8% | 95.6% |
| Range | 40.5% | 59.0% |
| Mean | 49.0% | 66.5% |
| Median | 48.8% | 67.2% |
| Interquartile 25% (IQ1) | 42.7% | 59.8% |
| Interquartile 75% (IQ3) | 55.4% | 71.5% |
| Interquartile Range (IQR) | 12.7% | 11.7% |
| Standard Deviation (Sample) | 9.6% | 10.8% |
| Standard Deviation (Population) | 9.5% | 10.7% |
Similar Demographics by College, Under 1 year
Demographics Similar to Seminole by College, Under 1 year
In terms of college, under 1 year, the demographic groups most similar to Seminole are Immigrants from Belize (59.1%, a difference of 0.020%), Immigrants from Grenada (59.1%, a difference of 0.12%), Central American Indian (59.0%, a difference of 0.16%), Nicaraguan (59.2%, a difference of 0.18%), and Guyanese (59.0%, a difference of 0.21%).
| Demographics | Rating | Rank | College, Under 1 year |
| British West Indians | 0.0 /100 | #286 | Tragic 59.5% |
| Sioux | 0.0 /100 | #287 | Tragic 59.4% |
| Blacks/African Americans | 0.0 /100 | #288 | Tragic 59.4% |
| Choctaw | 0.0 /100 | #289 | Tragic 59.3% |
| Ecuadorians | 0.0 /100 | #290 | Tragic 59.3% |
| Creek | 0.0 /100 | #291 | Tragic 59.3% |
| Nicaraguans | 0.0 /100 | #292 | Tragic 59.2% |
| Seminole | 0.0 /100 | #293 | Tragic 59.1% |
| Immigrants | Belize | 0.0 /100 | #294 | Tragic 59.1% |
| Immigrants | Grenada | 0.0 /100 | #295 | Tragic 59.1% |
| Central American Indians | 0.0 /100 | #296 | Tragic 59.0% |
| Guyanese | 0.0 /100 | #297 | Tragic 59.0% |
| Immigrants | Ecuador | 0.0 /100 | #298 | Tragic 58.7% |
| Cubans | 0.0 /100 | #299 | Tragic 58.6% |
| Immigrants | Guyana | 0.0 /100 | #300 | Tragic 58.5% |
Demographics Similar to Immigrants from Jordan by College, Under 1 year
In terms of college, under 1 year, the demographic groups most similar to Immigrants from Jordan are Immigrants from Northern Africa (67.2%, a difference of 0.020%), Arab (67.2%, a difference of 0.030%), Slovene (67.3%, a difference of 0.090%), Italian (67.2%, a difference of 0.15%), and Serbian (67.4%, a difference of 0.18%).
| Demographics | Rating | Rank | College, Under 1 year |
| Basques | 95.2 /100 | #115 | Exceptional 67.6% |
| Immigrants | Nepal | 94.9 /100 | #116 | Exceptional 67.5% |
| Pakistanis | 94.8 /100 | #117 | Exceptional 67.5% |
| Immigrants | Ukraine | 94.7 /100 | #118 | Exceptional 67.5% |
| Lebanese | 94.6 /100 | #119 | Exceptional 67.5% |
| Serbians | 93.9 /100 | #120 | Exceptional 67.4% |
| Slovenes | 93.3 /100 | #121 | Exceptional 67.3% |
| Immigrants | Jordan | 92.8 /100 | #122 | Exceptional 67.3% |
| Immigrants | Northern Africa | 92.7 /100 | #123 | Exceptional 67.2% |
| Arabs | 92.6 /100 | #124 | Exceptional 67.2% |
| Italians | 91.8 /100 | #125 | Exceptional 67.2% |
| Alsatians | 91.3 /100 | #126 | Exceptional 67.1% |
| Czechs | 90.8 /100 | #127 | Exceptional 67.1% |
| Scottish | 90.2 /100 | #128 | Exceptional 67.0% |
| Immigrants | Eastern Africa | 89.5 /100 | #129 | Excellent 67.0% |