Ghanaian vs Dutch West Indian College, Under 1 year
COMPARE
Ghanaian
Dutch West Indian
College, Under 1 year
College, Under 1 year Comparison
Ghanaians
Dutch West Indians
63.9%
COLLEGE, UNDER 1 YEAR
11.2/ 100
METRIC RATING
210th/ 347
METRIC RANK
57.2%
COLLEGE, UNDER 1 YEAR
0.0/ 100
METRIC RATING
313th/ 347
METRIC RANK
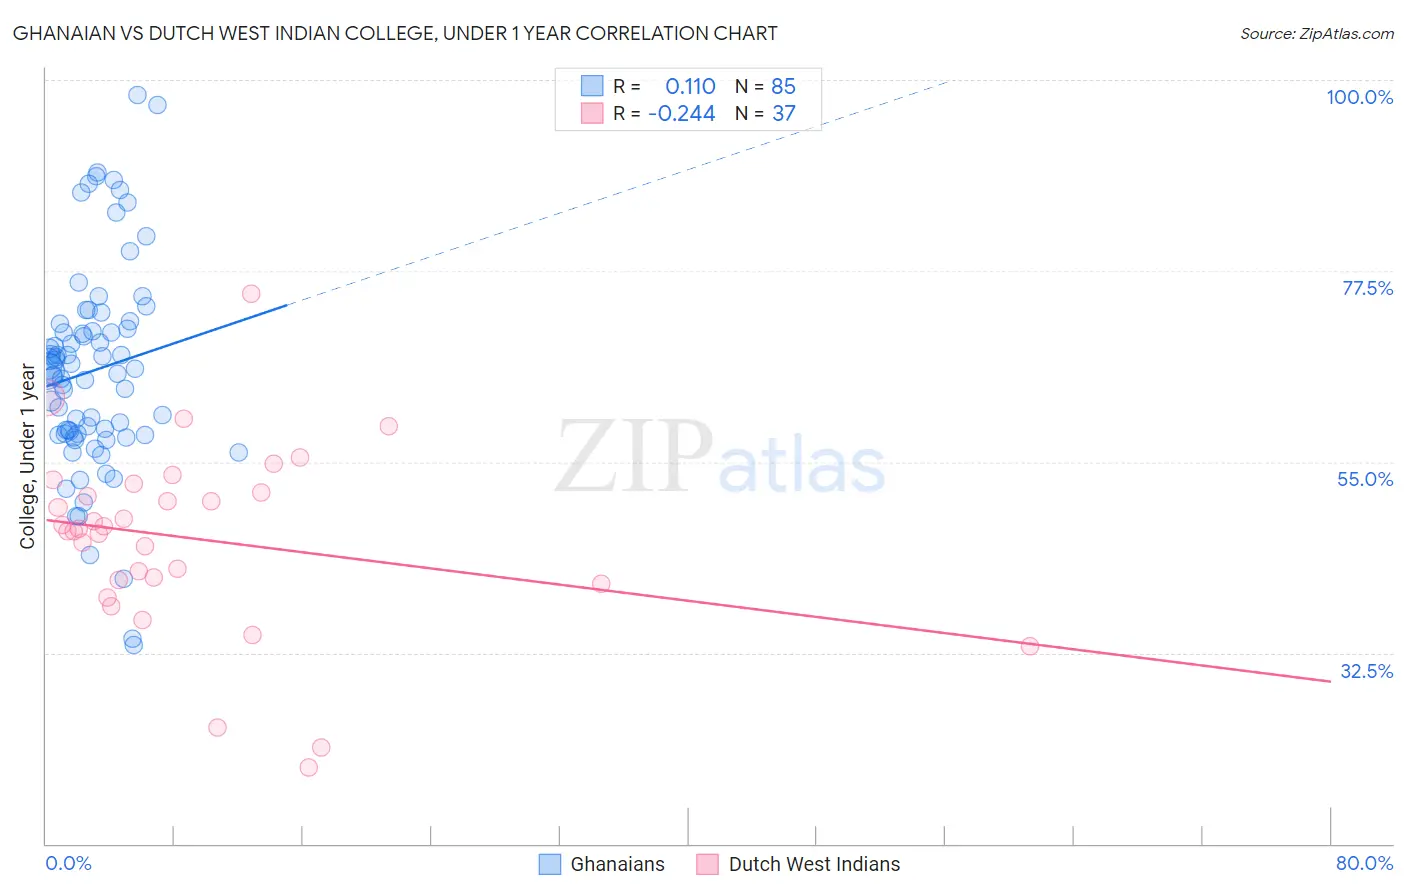
Ghanaian vs Dutch West Indian College, Under 1 year Correlation Chart
The statistical analysis conducted on geographies consisting of 190,712,650 people shows a poor positive correlation between the proportion of Ghanaians and percentage of population with at least college, under 1 year education in the United States with a correlation coefficient (R) of 0.110 and weighted average of 63.9%. Similarly, the statistical analysis conducted on geographies consisting of 85,776,067 people shows a weak negative correlation between the proportion of Dutch West Indians and percentage of population with at least college, under 1 year education in the United States with a correlation coefficient (R) of -0.244 and weighted average of 57.2%, a difference of 11.8%.
College, Under 1 year Correlation Summary
| Measurement | Ghanaian | Dutch West Indian |
| Minimum | 33.5% | 19.0% |
| Maximum | 98.2% | 74.8% |
| Range | 64.7% | 55.8% |
| Mean | 65.8% | 45.9% |
| Median | 65.7% | 47.1% |
| Interquartile 25% (IQ1) | 58.3% | 40.9% |
| Interquartile 75% (IQ3) | 71.0% | 51.9% |
| Interquartile Range (IQR) | 12.7% | 11.1% |
| Standard Deviation (Sample) | 12.3% | 11.0% |
| Standard Deviation (Population) | 12.3% | 10.8% |
Similar Demographics by College, Under 1 year
Demographics Similar to Ghanaians by College, Under 1 year
In terms of college, under 1 year, the demographic groups most similar to Ghanaians are Puget Sound Salish (63.9%, a difference of 0.010%), Native Hawaiian (63.9%, a difference of 0.070%), Immigrants from Middle Africa (63.9%, a difference of 0.080%), Immigrants from Vietnam (64.0%, a difference of 0.10%), and Colombian (64.0%, a difference of 0.13%).
| Demographics | Rating | Rank | College, Under 1 year |
| Uruguayans | 15.6 /100 | #203 | Poor 64.2% |
| Immigrants | Zaire | 14.6 /100 | #204 | Poor 64.1% |
| Peruvians | 13.7 /100 | #205 | Poor 64.1% |
| Whites/Caucasians | 12.8 /100 | #206 | Poor 64.0% |
| Colombians | 12.4 /100 | #207 | Poor 64.0% |
| Immigrants | Vietnam | 12.1 /100 | #208 | Poor 64.0% |
| Puget Sound Salish | 11.3 /100 | #209 | Poor 63.9% |
| Ghanaians | 11.2 /100 | #210 | Poor 63.9% |
| Native Hawaiians | 10.6 /100 | #211 | Poor 63.9% |
| Immigrants | Middle Africa | 10.5 /100 | #212 | Poor 63.9% |
| Immigrants | South America | 9.1 /100 | #213 | Tragic 63.8% |
| Immigrants | Nigeria | 8.8 /100 | #214 | Tragic 63.7% |
| Senegalese | 7.7 /100 | #215 | Tragic 63.6% |
| Hmong | 6.8 /100 | #216 | Tragic 63.5% |
| Immigrants | Uruguay | 5.8 /100 | #217 | Tragic 63.4% |
Demographics Similar to Dutch West Indians by College, Under 1 year
In terms of college, under 1 year, the demographic groups most similar to Dutch West Indians are Hopi (57.1%, a difference of 0.12%), Honduran (57.1%, a difference of 0.16%), Menominee (57.0%, a difference of 0.22%), Salvadoran (57.3%, a difference of 0.24%), and Hispanic or Latino (57.0%, a difference of 0.26%).
| Demographics | Rating | Rank | College, Under 1 year |
| Immigrants | Portugal | 0.0 /100 | #306 | Tragic 57.7% |
| Fijians | 0.0 /100 | #307 | Tragic 57.7% |
| Central Americans | 0.0 /100 | #308 | Tragic 57.7% |
| Immigrants | Nicaragua | 0.0 /100 | #309 | Tragic 57.6% |
| Pueblo | 0.0 /100 | #310 | Tragic 57.4% |
| Cajuns | 0.0 /100 | #311 | Tragic 57.3% |
| Salvadorans | 0.0 /100 | #312 | Tragic 57.3% |
| Dutch West Indians | 0.0 /100 | #313 | Tragic 57.2% |
| Hopi | 0.0 /100 | #314 | Tragic 57.1% |
| Hondurans | 0.0 /100 | #315 | Tragic 57.1% |
| Menominee | 0.0 /100 | #316 | Tragic 57.0% |
| Hispanics or Latinos | 0.0 /100 | #317 | Tragic 57.0% |
| Immigrants | Haiti | 0.0 /100 | #318 | Tragic 56.9% |
| Puerto Ricans | 0.0 /100 | #319 | Tragic 56.8% |
| Guatemalans | 0.0 /100 | #320 | Tragic 56.8% |