Ghanaian vs Immigrants from Venezuela College, Under 1 year
COMPARE
Ghanaian
Immigrants from Venezuela
College, Under 1 year
College, Under 1 year Comparison
Ghanaians
Immigrants from Venezuela
63.9%
COLLEGE, UNDER 1 YEAR
11.2/ 100
METRIC RATING
210th/ 347
METRIC RANK
66.3%
COLLEGE, UNDER 1 YEAR
77.9/ 100
METRIC RATING
149th/ 347
METRIC RANK
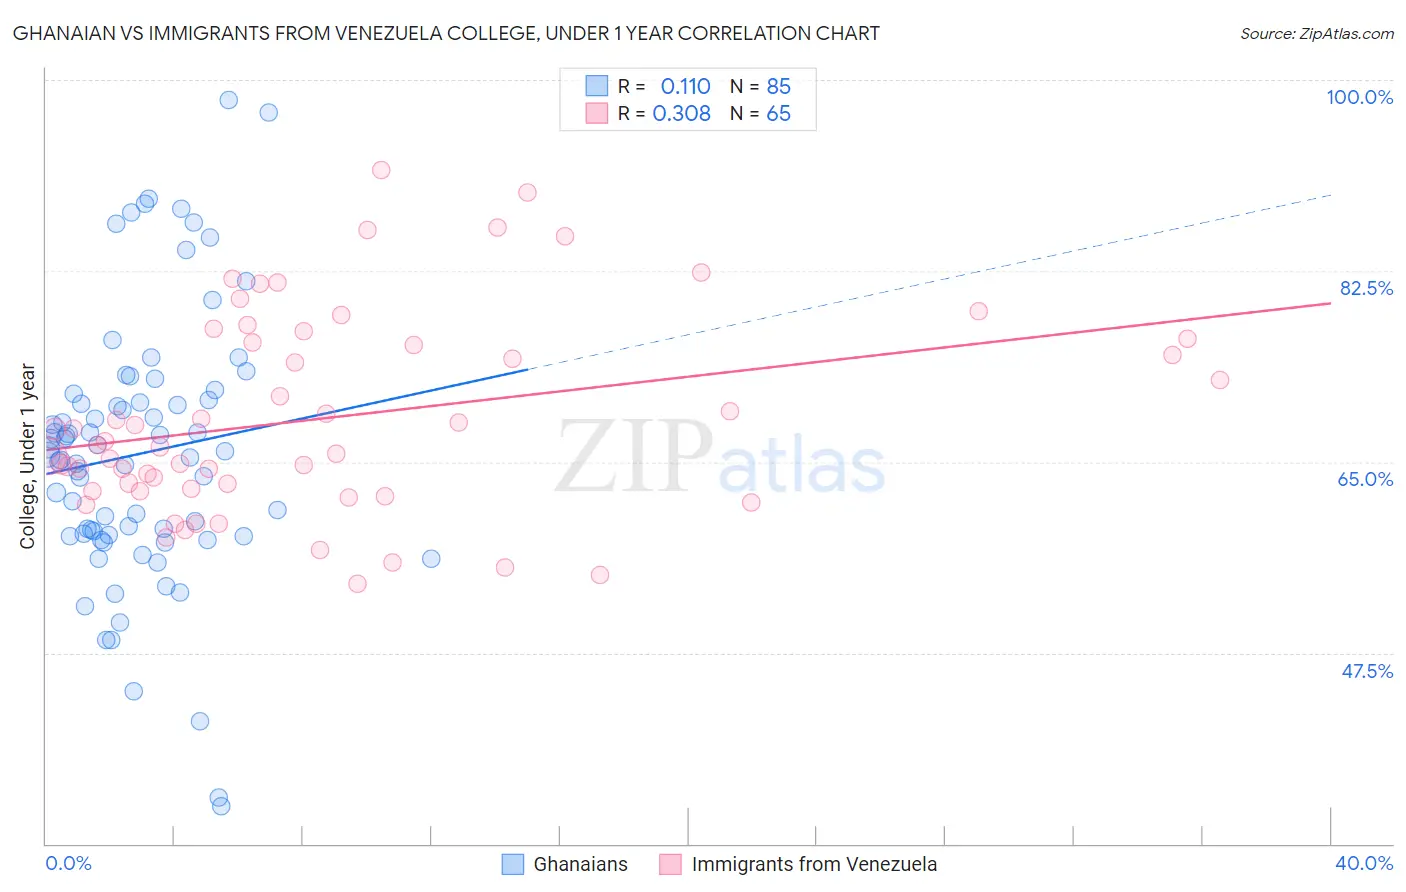
Ghanaian vs Immigrants from Venezuela College, Under 1 year Correlation Chart
The statistical analysis conducted on geographies consisting of 190,712,650 people shows a poor positive correlation between the proportion of Ghanaians and percentage of population with at least college, under 1 year education in the United States with a correlation coefficient (R) of 0.110 and weighted average of 63.9%. Similarly, the statistical analysis conducted on geographies consisting of 287,866,009 people shows a mild positive correlation between the proportion of Immigrants from Venezuela and percentage of population with at least college, under 1 year education in the United States with a correlation coefficient (R) of 0.308 and weighted average of 66.3%, a difference of 3.7%.
College, Under 1 year Correlation Summary
| Measurement | Ghanaian | Immigrants from Venezuela |
| Minimum | 33.5% | 53.8% |
| Maximum | 98.2% | 91.7% |
| Range | 64.7% | 37.9% |
| Mean | 65.8% | 69.0% |
| Median | 65.7% | 66.5% |
| Interquartile 25% (IQ1) | 58.3% | 62.4% |
| Interquartile 75% (IQ3) | 71.0% | 76.1% |
| Interquartile Range (IQR) | 12.7% | 13.7% |
| Standard Deviation (Sample) | 12.3% | 9.2% |
| Standard Deviation (Population) | 12.3% | 9.1% |
Similar Demographics by College, Under 1 year
Demographics Similar to Ghanaians by College, Under 1 year
In terms of college, under 1 year, the demographic groups most similar to Ghanaians are Puget Sound Salish (63.9%, a difference of 0.010%), Native Hawaiian (63.9%, a difference of 0.070%), Immigrants from Middle Africa (63.9%, a difference of 0.080%), Immigrants from Vietnam (64.0%, a difference of 0.10%), and Colombian (64.0%, a difference of 0.13%).
| Demographics | Rating | Rank | College, Under 1 year |
| Uruguayans | 15.6 /100 | #203 | Poor 64.2% |
| Immigrants | Zaire | 14.6 /100 | #204 | Poor 64.1% |
| Peruvians | 13.7 /100 | #205 | Poor 64.1% |
| Whites/Caucasians | 12.8 /100 | #206 | Poor 64.0% |
| Colombians | 12.4 /100 | #207 | Poor 64.0% |
| Immigrants | Vietnam | 12.1 /100 | #208 | Poor 64.0% |
| Puget Sound Salish | 11.3 /100 | #209 | Poor 63.9% |
| Ghanaians | 11.2 /100 | #210 | Poor 63.9% |
| Native Hawaiians | 10.6 /100 | #211 | Poor 63.9% |
| Immigrants | Middle Africa | 10.5 /100 | #212 | Poor 63.9% |
| Immigrants | South America | 9.1 /100 | #213 | Tragic 63.8% |
| Immigrants | Nigeria | 8.8 /100 | #214 | Tragic 63.7% |
| Senegalese | 7.7 /100 | #215 | Tragic 63.6% |
| Hmong | 6.8 /100 | #216 | Tragic 63.5% |
| Immigrants | Uruguay | 5.8 /100 | #217 | Tragic 63.4% |
Demographics Similar to Immigrants from Venezuela by College, Under 1 year
In terms of college, under 1 year, the demographic groups most similar to Immigrants from Venezuela are Taiwanese (66.4%, a difference of 0.040%), Immigrants from Iraq (66.3%, a difference of 0.050%), Immigrants from Sudan (66.2%, a difference of 0.12%), Sudanese (66.2%, a difference of 0.23%), and Immigrants from Morocco (66.5%, a difference of 0.25%).
| Demographics | Rating | Rank | College, Under 1 year |
| English | 82.9 /100 | #142 | Excellent 66.6% |
| Immigrants | Uganda | 82.8 /100 | #143 | Excellent 66.5% |
| Immigrants | Germany | 82.0 /100 | #144 | Excellent 66.5% |
| Immigrants | Kenya | 81.8 /100 | #145 | Excellent 66.5% |
| Kenyans | 81.7 /100 | #146 | Excellent 66.5% |
| Immigrants | Morocco | 81.7 /100 | #147 | Excellent 66.5% |
| Taiwanese | 78.6 /100 | #148 | Good 66.4% |
| Immigrants | Venezuela | 77.9 /100 | #149 | Good 66.3% |
| Immigrants | Iraq | 77.1 /100 | #150 | Good 66.3% |
| Immigrants | Sudan | 76.0 /100 | #151 | Good 66.2% |
| Sudanese | 74.1 /100 | #152 | Good 66.2% |
| Belgians | 73.7 /100 | #153 | Good 66.2% |
| Immigrants | Eritrea | 71.9 /100 | #154 | Good 66.1% |
| Irish | 70.3 /100 | #155 | Good 66.0% |
| Welsh | 69.9 /100 | #156 | Good 66.0% |