German Russian vs Immigrants from Laos 9th Grade
COMPARE
German Russian
Immigrants from Laos
9th Grade
9th Grade Comparison
German Russians
Immigrants from Laos
95.4%
9TH GRADE
96.1/ 100
METRIC RATING
114th/ 347
METRIC RANK
93.2%
9TH GRADE
0.0/ 100
METRIC RATING
292nd/ 347
METRIC RANK
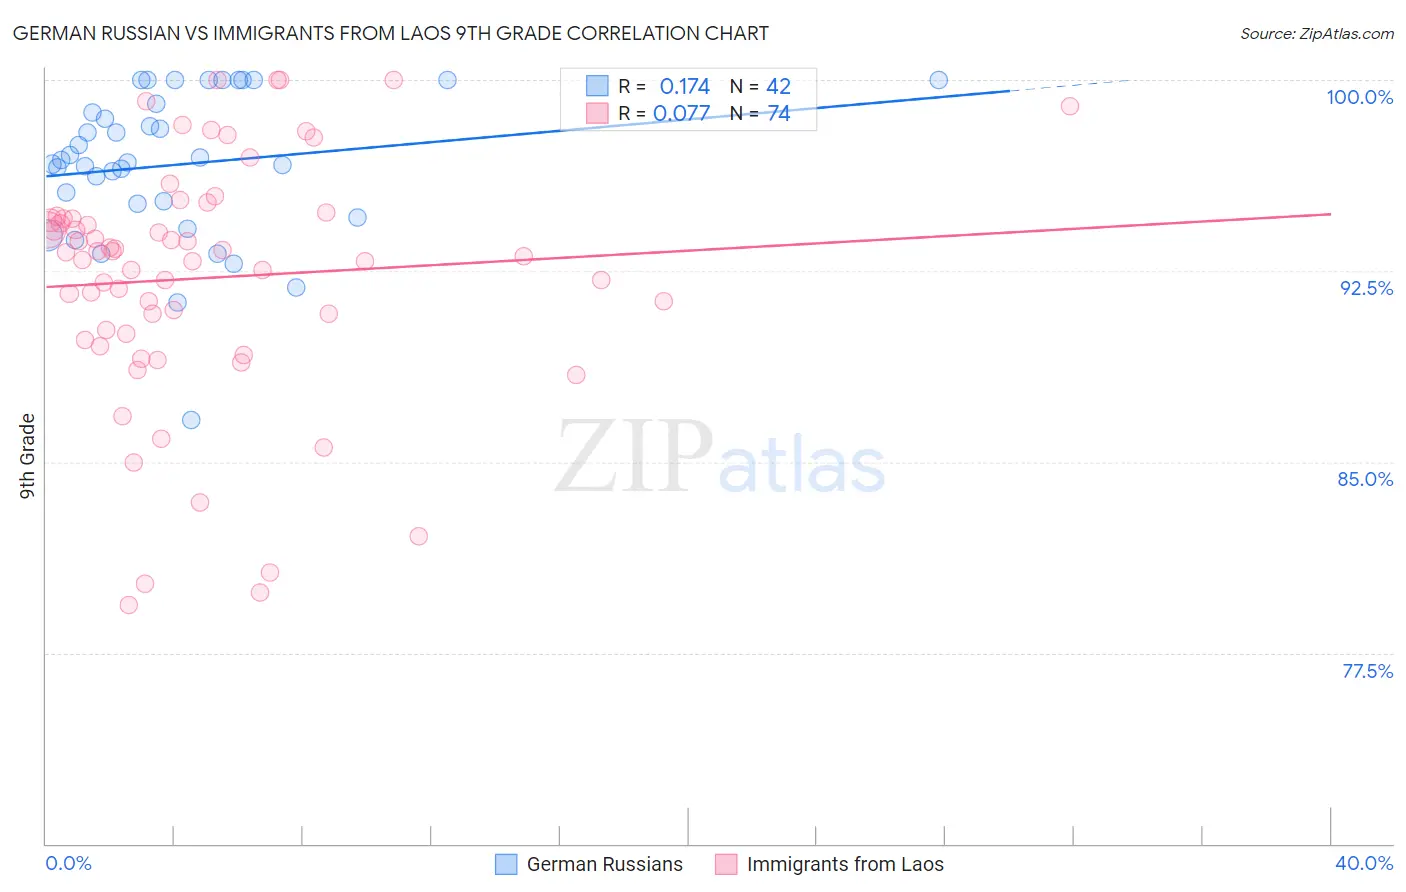
German Russian vs Immigrants from Laos 9th Grade Correlation Chart
The statistical analysis conducted on geographies consisting of 96,461,461 people shows a poor positive correlation between the proportion of German Russians and percentage of population with at least 9th grade education in the United States with a correlation coefficient (R) of 0.174 and weighted average of 95.4%. Similarly, the statistical analysis conducted on geographies consisting of 201,472,886 people shows a slight positive correlation between the proportion of Immigrants from Laos and percentage of population with at least 9th grade education in the United States with a correlation coefficient (R) of 0.077 and weighted average of 93.2%, a difference of 2.4%.
9th Grade Correlation Summary
| Measurement | German Russian | Immigrants from Laos |
| Minimum | 86.6% | 79.4% |
| Maximum | 100.0% | 100.0% |
| Range | 13.4% | 20.6% |
| Mean | 96.7% | 92.2% |
| Median | 96.8% | 93.1% |
| Interquartile 25% (IQ1) | 95.1% | 90.0% |
| Interquartile 75% (IQ3) | 99.1% | 94.6% |
| Interquartile Range (IQR) | 4.0% | 4.5% |
| Standard Deviation (Sample) | 3.0% | 4.8% |
| Standard Deviation (Population) | 2.9% | 4.8% |
Similar Demographics by 9th Grade
Demographics Similar to German Russians by 9th Grade
In terms of 9th grade, the demographic groups most similar to German Russians are Iroquois (95.4%, a difference of 0.0%), Burmese (95.4%, a difference of 0.0%), Cherokee (95.4%, a difference of 0.010%), Immigrants from Croatia (95.4%, a difference of 0.010%), and Immigrants from Europe (95.4%, a difference of 0.020%).
| Demographics | Rating | Rank | 9th Grade |
| Immigrants | Zimbabwe | 96.9 /100 | #107 | Exceptional 95.5% |
| Chickasaw | 96.8 /100 | #108 | Exceptional 95.5% |
| Osage | 96.8 /100 | #109 | Exceptional 95.5% |
| Immigrants | Bulgaria | 96.7 /100 | #110 | Exceptional 95.5% |
| Cherokee | 96.3 /100 | #111 | Exceptional 95.4% |
| Immigrants | Croatia | 96.2 /100 | #112 | Exceptional 95.4% |
| Iroquois | 96.2 /100 | #113 | Exceptional 95.4% |
| German Russians | 96.1 /100 | #114 | Exceptional 95.4% |
| Burmese | 96.0 /100 | #115 | Exceptional 95.4% |
| Immigrants | Europe | 95.7 /100 | #116 | Exceptional 95.4% |
| Immigrants | Romania | 95.6 /100 | #117 | Exceptional 95.4% |
| Immigrants | Turkey | 95.6 /100 | #118 | Exceptional 95.4% |
| Soviet Union | 95.6 /100 | #119 | Exceptional 95.4% |
| Cambodians | 95.6 /100 | #120 | Exceptional 95.4% |
| Cree | 95.5 /100 | #121 | Exceptional 95.4% |
Demographics Similar to Immigrants from Laos by 9th Grade
In terms of 9th grade, the demographic groups most similar to Immigrants from Laos are Sri Lankan (93.2%, a difference of 0.010%), British West Indian (93.2%, a difference of 0.020%), Cuban (93.2%, a difference of 0.020%), Immigrants from Burma/Myanmar (93.1%, a difference of 0.040%), and Indonesian (93.1%, a difference of 0.040%).
| Demographics | Rating | Rank | 9th Grade |
| Immigrants | Peru | 0.0 /100 | #285 | Tragic 93.4% |
| Immigrants | Barbados | 0.0 /100 | #286 | Tragic 93.4% |
| Immigrants | St. Vincent and the Grenadines | 0.0 /100 | #287 | Tragic 93.4% |
| Immigrants | South Eastern Asia | 0.0 /100 | #288 | Tragic 93.3% |
| Immigrants | West Indies | 0.0 /100 | #289 | Tragic 93.3% |
| Pennsylvania Germans | 0.0 /100 | #290 | Tragic 93.3% |
| British West Indians | 0.0 /100 | #291 | Tragic 93.2% |
| Immigrants | Laos | 0.0 /100 | #292 | Tragic 93.2% |
| Sri Lankans | 0.0 /100 | #293 | Tragic 93.2% |
| Cubans | 0.0 /100 | #294 | Tragic 93.2% |
| Immigrants | Burma/Myanmar | 0.0 /100 | #295 | Tragic 93.1% |
| Indonesians | 0.0 /100 | #296 | Tragic 93.1% |
| Fijians | 0.0 /100 | #297 | Tragic 93.1% |
| Haitians | 0.0 /100 | #298 | Tragic 93.1% |
| Immigrants | Grenada | 0.0 /100 | #299 | Tragic 93.0% |