German Russian vs French 9th Grade
COMPARE
German Russian
French
9th Grade
9th Grade Comparison
German Russians
French
95.4%
9TH GRADE
96.1/ 100
METRIC RATING
114th/ 347
METRIC RANK
96.3%
9TH GRADE
100.0/ 100
METRIC RATING
25th/ 347
METRIC RANK
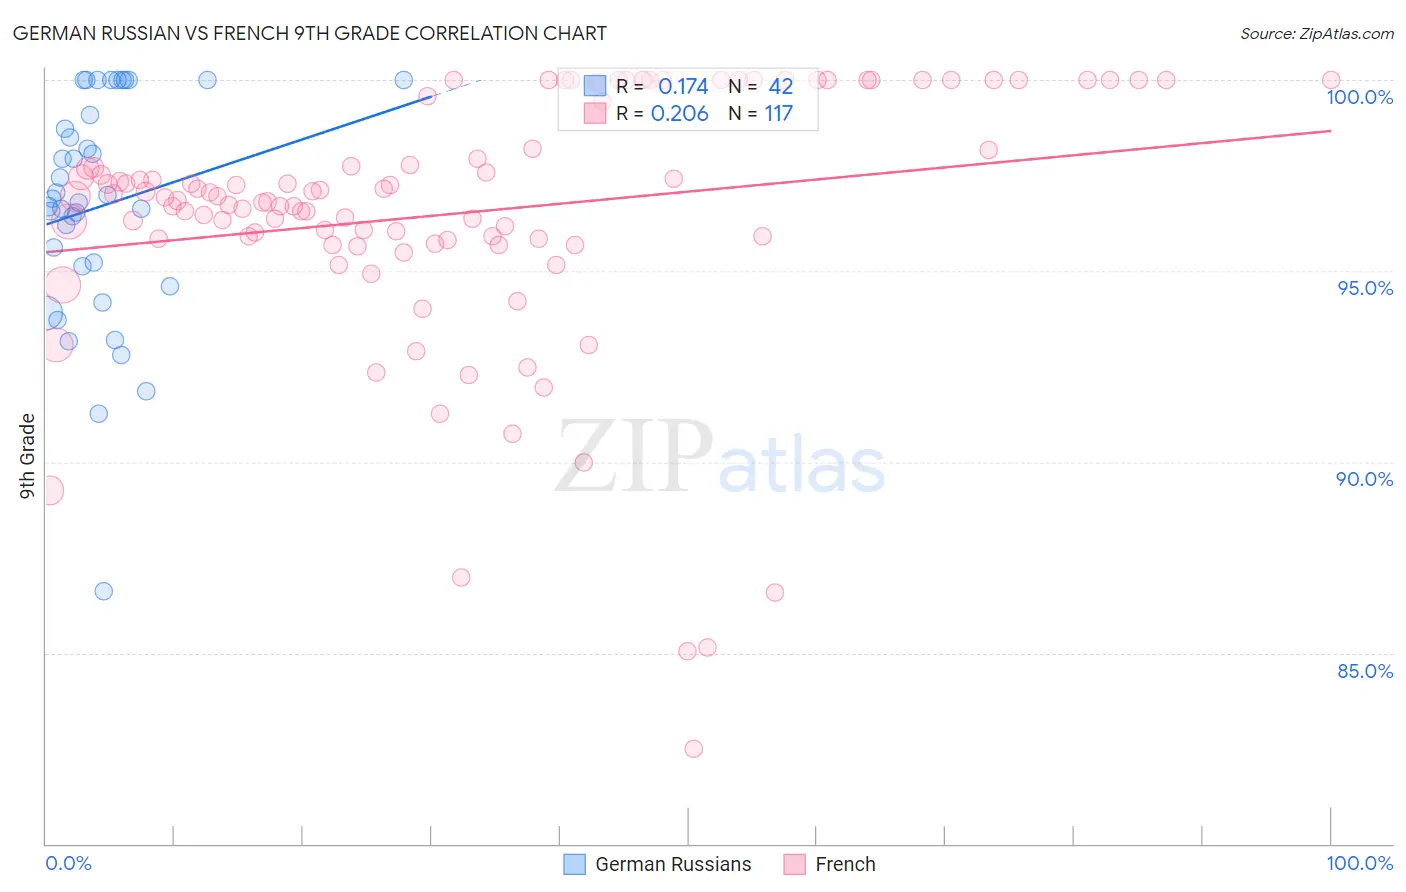
German Russian vs French 9th Grade Correlation Chart
The statistical analysis conducted on geographies consisting of 96,461,461 people shows a poor positive correlation between the proportion of German Russians and percentage of population with at least 9th grade education in the United States with a correlation coefficient (R) of 0.174 and weighted average of 95.4%. Similarly, the statistical analysis conducted on geographies consisting of 572,427,255 people shows a weak positive correlation between the proportion of French and percentage of population with at least 9th grade education in the United States with a correlation coefficient (R) of 0.206 and weighted average of 96.3%, a difference of 0.95%.
9th Grade Correlation Summary
| Measurement | German Russian | French |
| Minimum | 86.6% | 82.5% |
| Maximum | 100.0% | 100.0% |
| Range | 13.4% | 17.5% |
| Mean | 96.7% | 96.5% |
| Median | 96.8% | 96.9% |
| Interquartile 25% (IQ1) | 95.1% | 95.8% |
| Interquartile 75% (IQ3) | 99.1% | 99.5% |
| Interquartile Range (IQR) | 4.0% | 3.7% |
| Standard Deviation (Sample) | 3.0% | 3.4% |
| Standard Deviation (Population) | 2.9% | 3.4% |
Similar Demographics by 9th Grade
Demographics Similar to German Russians by 9th Grade
In terms of 9th grade, the demographic groups most similar to German Russians are Iroquois (95.4%, a difference of 0.0%), Burmese (95.4%, a difference of 0.0%), Cherokee (95.4%, a difference of 0.010%), Immigrants from Croatia (95.4%, a difference of 0.010%), and Immigrants from Europe (95.4%, a difference of 0.020%).
| Demographics | Rating | Rank | 9th Grade |
| Immigrants | Zimbabwe | 96.9 /100 | #107 | Exceptional 95.5% |
| Chickasaw | 96.8 /100 | #108 | Exceptional 95.5% |
| Osage | 96.8 /100 | #109 | Exceptional 95.5% |
| Immigrants | Bulgaria | 96.7 /100 | #110 | Exceptional 95.5% |
| Cherokee | 96.3 /100 | #111 | Exceptional 95.4% |
| Immigrants | Croatia | 96.2 /100 | #112 | Exceptional 95.4% |
| Iroquois | 96.2 /100 | #113 | Exceptional 95.4% |
| German Russians | 96.1 /100 | #114 | Exceptional 95.4% |
| Burmese | 96.0 /100 | #115 | Exceptional 95.4% |
| Immigrants | Europe | 95.7 /100 | #116 | Exceptional 95.4% |
| Immigrants | Romania | 95.6 /100 | #117 | Exceptional 95.4% |
| Immigrants | Turkey | 95.6 /100 | #118 | Exceptional 95.4% |
| Soviet Union | 95.6 /100 | #119 | Exceptional 95.4% |
| Cambodians | 95.6 /100 | #120 | Exceptional 95.4% |
| Cree | 95.5 /100 | #121 | Exceptional 95.4% |
Demographics Similar to French by 9th Grade
In terms of 9th grade, the demographic groups most similar to French are Latvian (96.4%, a difference of 0.010%), French Canadian (96.3%, a difference of 0.030%), Czech (96.4%, a difference of 0.040%), Scotch-Irish (96.3%, a difference of 0.040%), and Eastern European (96.3%, a difference of 0.040%).
| Demographics | Rating | Rank | 9th Grade |
| Scandinavians | 100.0 /100 | #18 | Exceptional 96.5% |
| Welsh | 100.0 /100 | #19 | Exceptional 96.4% |
| Italians | 100.0 /100 | #20 | Exceptional 96.4% |
| Alaskan Athabascans | 100.0 /100 | #21 | Exceptional 96.4% |
| Europeans | 100.0 /100 | #22 | Exceptional 96.4% |
| Czechs | 100.0 /100 | #23 | Exceptional 96.4% |
| Latvians | 100.0 /100 | #24 | Exceptional 96.4% |
| French | 100.0 /100 | #25 | Exceptional 96.3% |
| French Canadians | 100.0 /100 | #26 | Exceptional 96.3% |
| Scotch-Irish | 100.0 /100 | #27 | Exceptional 96.3% |
| Eastern Europeans | 100.0 /100 | #28 | Exceptional 96.3% |
| Chinese | 100.0 /100 | #29 | Exceptional 96.3% |
| Maltese | 100.0 /100 | #30 | Exceptional 96.3% |
| British | 100.0 /100 | #31 | Exceptional 96.3% |
| Belgians | 100.0 /100 | #32 | Exceptional 96.3% |