German Russian vs Alaska Native College, Under 1 year
COMPARE
German Russian
Alaska Native
College, Under 1 year
College, Under 1 year Comparison
German Russians
Alaska Natives
65.4%
COLLEGE, UNDER 1 YEAR
48.3/ 100
METRIC RATING
178th/ 347
METRIC RANK
60.4%
COLLEGE, UNDER 1 YEAR
0.1/ 100
METRIC RATING
274th/ 347
METRIC RANK
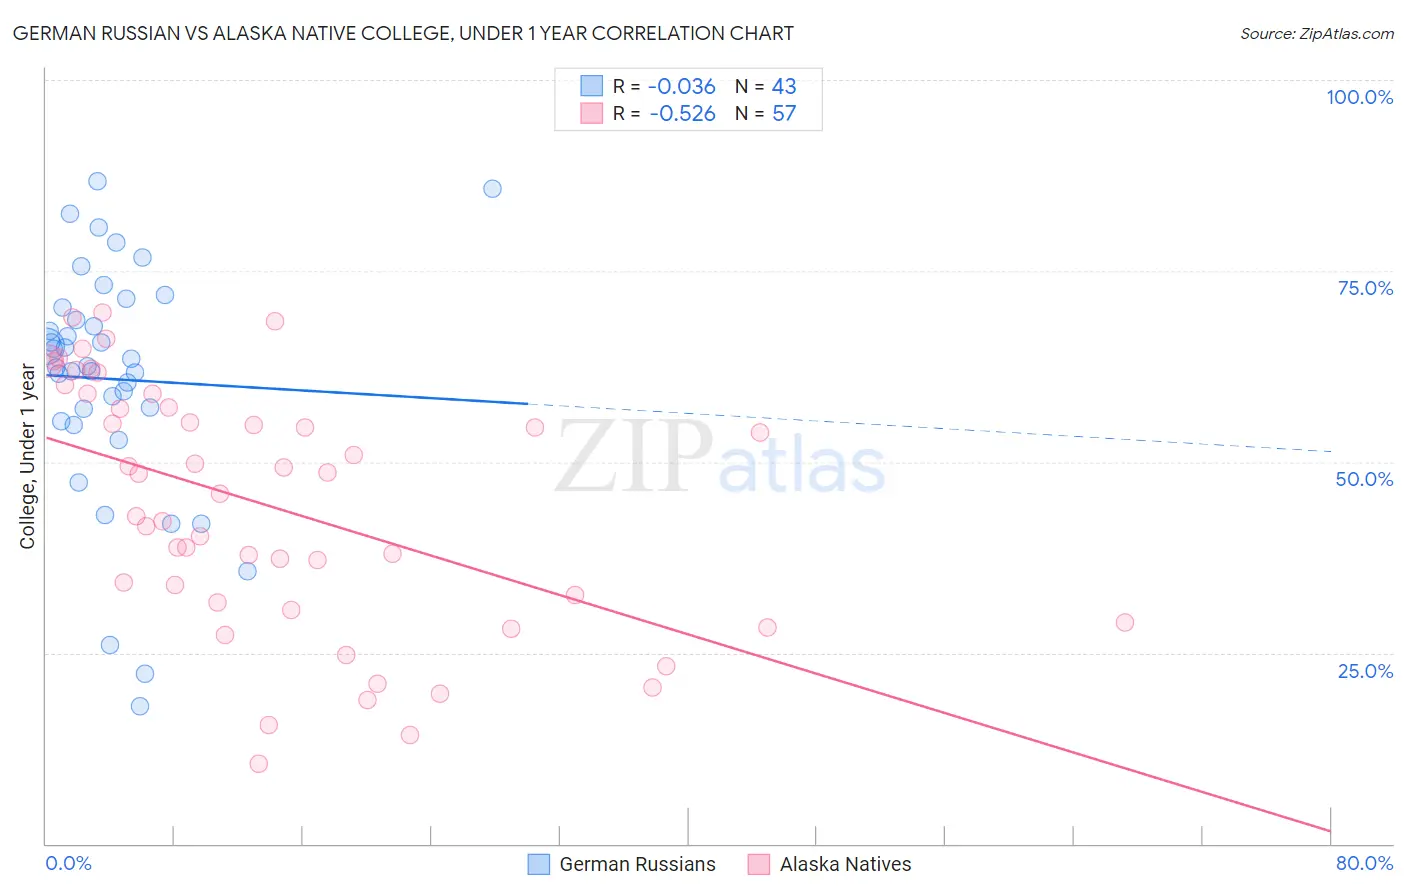
German Russian vs Alaska Native College, Under 1 year Correlation Chart
The statistical analysis conducted on geographies consisting of 96,461,984 people shows no correlation between the proportion of German Russians and percentage of population with at least college, under 1 year education in the United States with a correlation coefficient (R) of -0.036 and weighted average of 65.4%. Similarly, the statistical analysis conducted on geographies consisting of 76,778,531 people shows a substantial negative correlation between the proportion of Alaska Natives and percentage of population with at least college, under 1 year education in the United States with a correlation coefficient (R) of -0.526 and weighted average of 60.4%, a difference of 8.2%.
College, Under 1 year Correlation Summary
| Measurement | German Russian | Alaska Native |
| Minimum | 18.0% | 10.5% |
| Maximum | 86.7% | 69.5% |
| Range | 68.7% | 59.0% |
| Mean | 60.8% | 44.1% |
| Median | 62.5% | 45.8% |
| Interquartile 25% (IQ1) | 55.4% | 31.1% |
| Interquartile 75% (IQ3) | 70.2% | 58.0% |
| Interquartile Range (IQR) | 14.8% | 26.9% |
| Standard Deviation (Sample) | 15.6% | 16.2% |
| Standard Deviation (Population) | 15.4% | 16.0% |
Similar Demographics by College, Under 1 year
Demographics Similar to German Russians by College, Under 1 year
In terms of college, under 1 year, the demographic groups most similar to German Russians are Guamanian/Chamorro (65.4%, a difference of 0.0%), Immigrants from North Macedonia (65.4%, a difference of 0.010%), French (65.4%, a difference of 0.030%), Scotch-Irish (65.4%, a difference of 0.050%), and Immigrants from Bosnia and Herzegovina (65.4%, a difference of 0.080%).
| Demographics | Rating | Rank | College, Under 1 year |
| Immigrants | Oceania | 55.0 /100 | #171 | Average 65.6% |
| South American Indians | 54.4 /100 | #172 | Average 65.5% |
| Swiss | 53.9 /100 | #173 | Average 65.5% |
| Immigrants | Bosnia and Herzegovina | 50.0 /100 | #174 | Average 65.4% |
| Scotch-Irish | 49.5 /100 | #175 | Average 65.4% |
| French | 48.9 /100 | #176 | Average 65.4% |
| Immigrants | North Macedonia | 48.6 /100 | #177 | Average 65.4% |
| German Russians | 48.3 /100 | #178 | Average 65.4% |
| Guamanians/Chamorros | 48.2 /100 | #179 | Average 65.4% |
| Dutch | 46.1 /100 | #180 | Average 65.3% |
| Spaniards | 45.5 /100 | #181 | Average 65.3% |
| Immigrants | Africa | 44.7 /100 | #182 | Average 65.3% |
| Immigrants | Poland | 42.6 /100 | #183 | Average 65.2% |
| Bermudans | 42.0 /100 | #184 | Average 65.2% |
| Sri Lankans | 41.7 /100 | #185 | Average 65.2% |
Demographics Similar to Alaska Natives by College, Under 1 year
In terms of college, under 1 year, the demographic groups most similar to Alaska Natives are Chickasaw (60.4%, a difference of 0.0%), Jamaican (60.5%, a difference of 0.050%), Immigrants from Barbados (60.4%, a difference of 0.13%), Arapaho (60.3%, a difference of 0.16%), and U.S. Virgin Islander (60.6%, a difference of 0.20%).
| Demographics | Rating | Rank | College, Under 1 year |
| Americans | 0.2 /100 | #267 | Tragic 61.0% |
| Immigrants | Trinidad and Tobago | 0.1 /100 | #268 | Tragic 60.7% |
| Immigrants | West Indies | 0.1 /100 | #269 | Tragic 60.6% |
| Cheyenne | 0.1 /100 | #270 | Tragic 60.6% |
| U.S. Virgin Islanders | 0.1 /100 | #271 | Tragic 60.6% |
| Jamaicans | 0.1 /100 | #272 | Tragic 60.5% |
| Chickasaw | 0.1 /100 | #273 | Tragic 60.4% |
| Alaska Natives | 0.1 /100 | #274 | Tragic 60.4% |
| Immigrants | Barbados | 0.1 /100 | #275 | Tragic 60.4% |
| Arapaho | 0.1 /100 | #276 | Tragic 60.3% |
| Bahamians | 0.1 /100 | #277 | Tragic 60.3% |
| Yaqui | 0.1 /100 | #278 | Tragic 60.2% |
| Ute | 0.1 /100 | #279 | Tragic 60.2% |
| Crow | 0.1 /100 | #280 | Tragic 60.2% |
| Cherokee | 0.1 /100 | #281 | Tragic 60.1% |