German Russian vs Ugandan College, Under 1 year
COMPARE
German Russian
Ugandan
College, Under 1 year
College, Under 1 year Comparison
German Russians
Ugandans
65.4%
COLLEGE, UNDER 1 YEAR
48.3/ 100
METRIC RATING
178th/ 347
METRIC RANK
66.8%
COLLEGE, UNDER 1 YEAR
87.8/ 100
METRIC RATING
136th/ 347
METRIC RANK
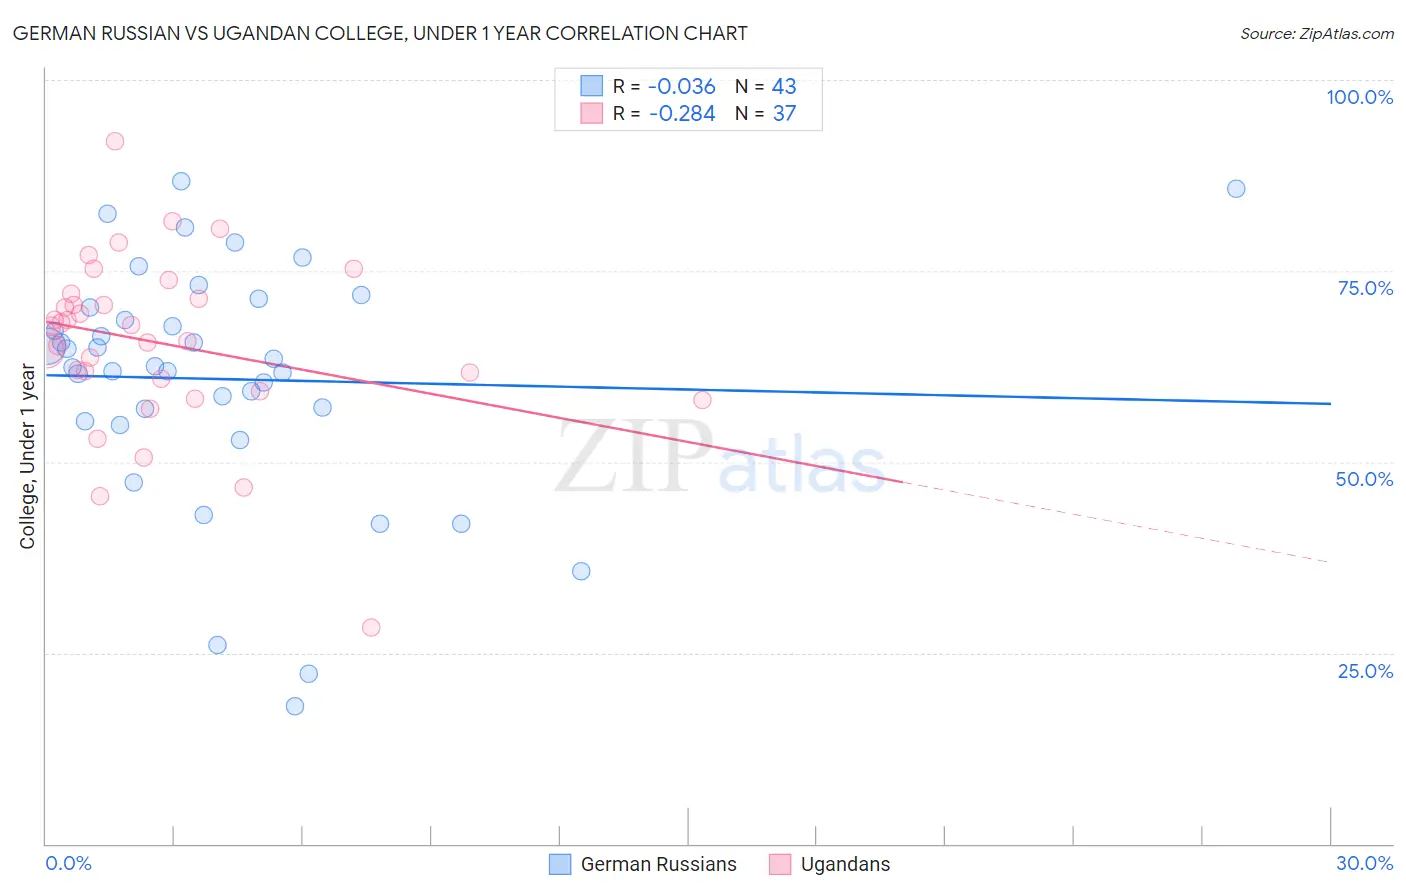
German Russian vs Ugandan College, Under 1 year Correlation Chart
The statistical analysis conducted on geographies consisting of 96,461,984 people shows no correlation between the proportion of German Russians and percentage of population with at least college, under 1 year education in the United States with a correlation coefficient (R) of -0.036 and weighted average of 65.4%. Similarly, the statistical analysis conducted on geographies consisting of 94,018,576 people shows a weak negative correlation between the proportion of Ugandans and percentage of population with at least college, under 1 year education in the United States with a correlation coefficient (R) of -0.284 and weighted average of 66.8%, a difference of 2.2%.
College, Under 1 year Correlation Summary
| Measurement | German Russian | Ugandan |
| Minimum | 18.0% | 28.3% |
| Maximum | 86.7% | 92.0% |
| Range | 68.7% | 63.7% |
| Mean | 60.8% | 65.6% |
| Median | 62.5% | 67.7% |
| Interquartile 25% (IQ1) | 55.4% | 60.1% |
| Interquartile 75% (IQ3) | 70.2% | 71.7% |
| Interquartile Range (IQR) | 14.8% | 11.5% |
| Standard Deviation (Sample) | 15.6% | 11.5% |
| Standard Deviation (Population) | 15.4% | 11.3% |
Similar Demographics by College, Under 1 year
Demographics Similar to German Russians by College, Under 1 year
In terms of college, under 1 year, the demographic groups most similar to German Russians are Guamanian/Chamorro (65.4%, a difference of 0.0%), Immigrants from North Macedonia (65.4%, a difference of 0.010%), French (65.4%, a difference of 0.030%), Scotch-Irish (65.4%, a difference of 0.050%), and Immigrants from Bosnia and Herzegovina (65.4%, a difference of 0.080%).
| Demographics | Rating | Rank | College, Under 1 year |
| Immigrants | Oceania | 55.0 /100 | #171 | Average 65.6% |
| South American Indians | 54.4 /100 | #172 | Average 65.5% |
| Swiss | 53.9 /100 | #173 | Average 65.5% |
| Immigrants | Bosnia and Herzegovina | 50.0 /100 | #174 | Average 65.4% |
| Scotch-Irish | 49.5 /100 | #175 | Average 65.4% |
| French | 48.9 /100 | #176 | Average 65.4% |
| Immigrants | North Macedonia | 48.6 /100 | #177 | Average 65.4% |
| German Russians | 48.3 /100 | #178 | Average 65.4% |
| Guamanians/Chamorros | 48.2 /100 | #179 | Average 65.4% |
| Dutch | 46.1 /100 | #180 | Average 65.3% |
| Spaniards | 45.5 /100 | #181 | Average 65.3% |
| Immigrants | Africa | 44.7 /100 | #182 | Average 65.3% |
| Immigrants | Poland | 42.6 /100 | #183 | Average 65.2% |
| Bermudans | 42.0 /100 | #184 | Average 65.2% |
| Sri Lankans | 41.7 /100 | #185 | Average 65.2% |
Demographics Similar to Ugandans by College, Under 1 year
In terms of college, under 1 year, the demographic groups most similar to Ugandans are Canadian (66.8%, a difference of 0.010%), Iraqi (66.8%, a difference of 0.020%), Immigrants from Chile (66.8%, a difference of 0.040%), Immigrants from Brazil (66.9%, a difference of 0.050%), and Polish (66.9%, a difference of 0.070%).
| Demographics | Rating | Rank | College, Under 1 year |
| Immigrants | Eastern Africa | 89.5 /100 | #129 | Excellent 67.0% |
| Immigrants | Syria | 89.0 /100 | #130 | Excellent 66.9% |
| Finns | 88.6 /100 | #131 | Excellent 66.9% |
| Poles | 88.4 /100 | #132 | Excellent 66.9% |
| Immigrants | Brazil | 88.3 /100 | #133 | Excellent 66.9% |
| Iraqis | 88.0 /100 | #134 | Excellent 66.8% |
| Canadians | 87.9 /100 | #135 | Excellent 66.8% |
| Ugandans | 87.8 /100 | #136 | Excellent 66.8% |
| Immigrants | Chile | 87.4 /100 | #137 | Excellent 66.8% |
| Immigrants | Italy | 86.9 /100 | #138 | Excellent 66.8% |
| Venezuelans | 85.9 /100 | #139 | Excellent 66.7% |
| Slavs | 85.9 /100 | #140 | Excellent 66.7% |
| Immigrants | Afghanistan | 85.1 /100 | #141 | Excellent 66.7% |
| English | 82.9 /100 | #142 | Excellent 66.6% |
| Immigrants | Uganda | 82.8 /100 | #143 | Excellent 66.5% |