Immigrants from Afghanistan vs Alaska Native College, Under 1 year
COMPARE
Immigrants from Afghanistan
Alaska Native
College, Under 1 year
College, Under 1 year Comparison
Immigrants from Afghanistan
Alaska Natives
66.7%
COLLEGE, UNDER 1 YEAR
85.1/ 100
METRIC RATING
141st/ 347
METRIC RANK
60.4%
COLLEGE, UNDER 1 YEAR
0.1/ 100
METRIC RATING
274th/ 347
METRIC RANK
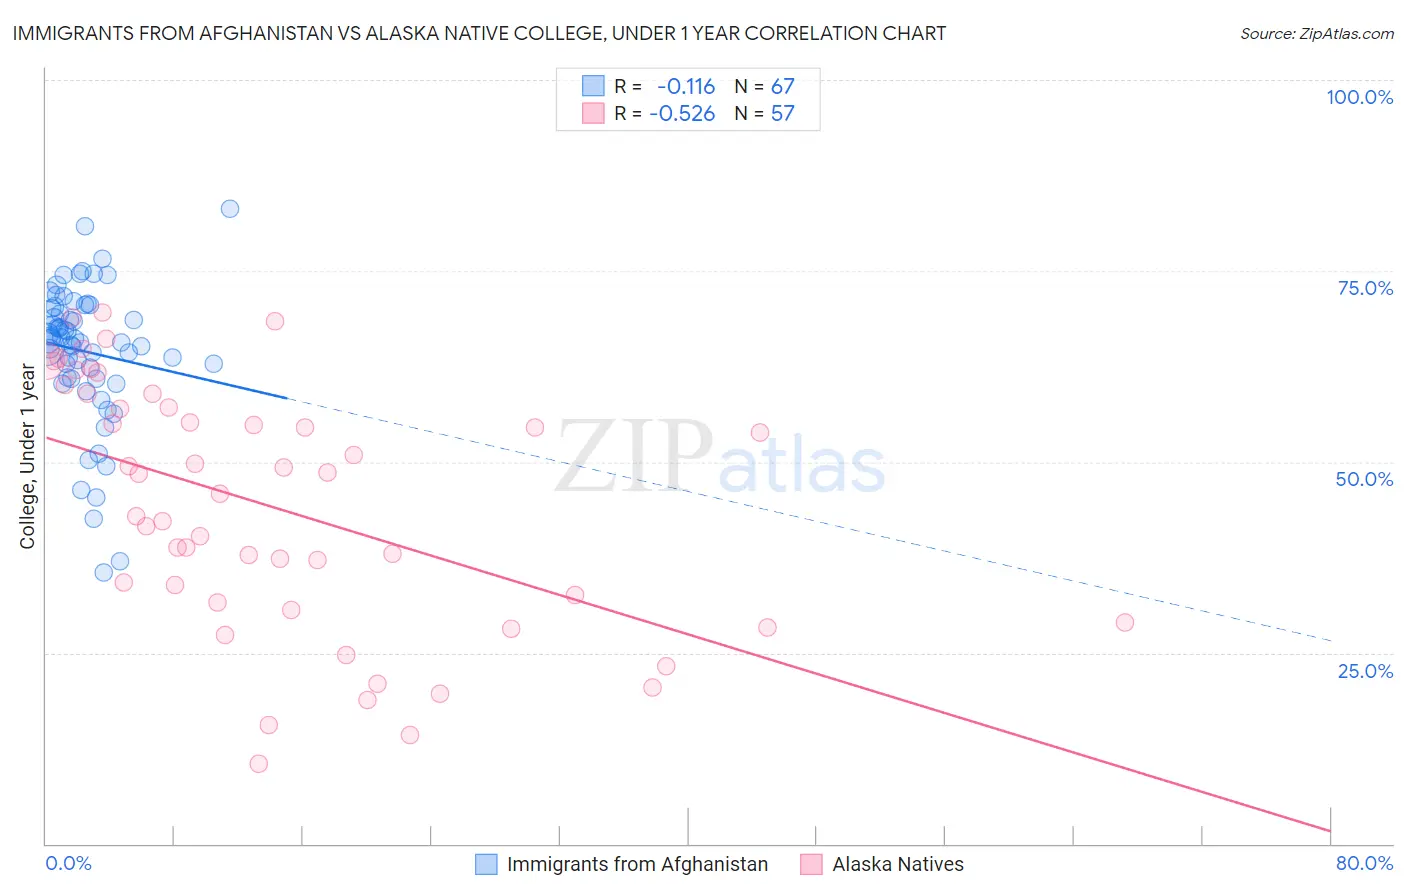
Immigrants from Afghanistan vs Alaska Native College, Under 1 year Correlation Chart
The statistical analysis conducted on geographies consisting of 147,647,192 people shows a poor negative correlation between the proportion of Immigrants from Afghanistan and percentage of population with at least college, under 1 year education in the United States with a correlation coefficient (R) of -0.116 and weighted average of 66.7%. Similarly, the statistical analysis conducted on geographies consisting of 76,778,531 people shows a substantial negative correlation between the proportion of Alaska Natives and percentage of population with at least college, under 1 year education in the United States with a correlation coefficient (R) of -0.526 and weighted average of 60.4%, a difference of 10.3%.
College, Under 1 year Correlation Summary
| Measurement | Immigrants from Afghanistan | Alaska Native |
| Minimum | 35.6% | 10.5% |
| Maximum | 83.1% | 69.5% |
| Range | 47.6% | 59.0% |
| Mean | 64.4% | 44.1% |
| Median | 65.9% | 45.8% |
| Interquartile 25% (IQ1) | 60.9% | 31.1% |
| Interquartile 75% (IQ3) | 70.3% | 58.0% |
| Interquartile Range (IQR) | 9.4% | 26.9% |
| Standard Deviation (Sample) | 9.3% | 16.2% |
| Standard Deviation (Population) | 9.2% | 16.0% |
Similar Demographics by College, Under 1 year
Demographics Similar to Immigrants from Afghanistan by College, Under 1 year
In terms of college, under 1 year, the demographic groups most similar to Immigrants from Afghanistan are Venezuelan (66.7%, a difference of 0.070%), Slavic (66.7%, a difference of 0.070%), Immigrants from Italy (66.8%, a difference of 0.17%), English (66.6%, a difference of 0.18%), and Immigrants from Uganda (66.5%, a difference of 0.19%).
| Demographics | Rating | Rank | College, Under 1 year |
| Iraqis | 88.0 /100 | #134 | Excellent 66.8% |
| Canadians | 87.9 /100 | #135 | Excellent 66.8% |
| Ugandans | 87.8 /100 | #136 | Excellent 66.8% |
| Immigrants | Chile | 87.4 /100 | #137 | Excellent 66.8% |
| Immigrants | Italy | 86.9 /100 | #138 | Excellent 66.8% |
| Venezuelans | 85.9 /100 | #139 | Excellent 66.7% |
| Slavs | 85.9 /100 | #140 | Excellent 66.7% |
| Immigrants | Afghanistan | 85.1 /100 | #141 | Excellent 66.7% |
| English | 82.9 /100 | #142 | Excellent 66.6% |
| Immigrants | Uganda | 82.8 /100 | #143 | Excellent 66.5% |
| Immigrants | Germany | 82.0 /100 | #144 | Excellent 66.5% |
| Immigrants | Kenya | 81.8 /100 | #145 | Excellent 66.5% |
| Kenyans | 81.7 /100 | #146 | Excellent 66.5% |
| Immigrants | Morocco | 81.7 /100 | #147 | Excellent 66.5% |
| Taiwanese | 78.6 /100 | #148 | Good 66.4% |
Demographics Similar to Alaska Natives by College, Under 1 year
In terms of college, under 1 year, the demographic groups most similar to Alaska Natives are Chickasaw (60.4%, a difference of 0.0%), Jamaican (60.5%, a difference of 0.050%), Immigrants from Barbados (60.4%, a difference of 0.13%), Arapaho (60.3%, a difference of 0.16%), and U.S. Virgin Islander (60.6%, a difference of 0.20%).
| Demographics | Rating | Rank | College, Under 1 year |
| Americans | 0.2 /100 | #267 | Tragic 61.0% |
| Immigrants | Trinidad and Tobago | 0.1 /100 | #268 | Tragic 60.7% |
| Immigrants | West Indies | 0.1 /100 | #269 | Tragic 60.6% |
| Cheyenne | 0.1 /100 | #270 | Tragic 60.6% |
| U.S. Virgin Islanders | 0.1 /100 | #271 | Tragic 60.6% |
| Jamaicans | 0.1 /100 | #272 | Tragic 60.5% |
| Chickasaw | 0.1 /100 | #273 | Tragic 60.4% |
| Alaska Natives | 0.1 /100 | #274 | Tragic 60.4% |
| Immigrants | Barbados | 0.1 /100 | #275 | Tragic 60.4% |
| Arapaho | 0.1 /100 | #276 | Tragic 60.3% |
| Bahamians | 0.1 /100 | #277 | Tragic 60.3% |
| Yaqui | 0.1 /100 | #278 | Tragic 60.2% |
| Ute | 0.1 /100 | #279 | Tragic 60.2% |
| Crow | 0.1 /100 | #280 | Tragic 60.2% |
| Cherokee | 0.1 /100 | #281 | Tragic 60.1% |