German Russian vs Immigrants from South Eastern Asia College, Under 1 year
COMPARE
German Russian
Immigrants from South Eastern Asia
College, Under 1 year
College, Under 1 year Comparison
German Russians
Immigrants from South Eastern Asia
65.4%
COLLEGE, UNDER 1 YEAR
48.3/ 100
METRIC RATING
178th/ 347
METRIC RANK
64.5%
COLLEGE, UNDER 1 YEAR
22.1/ 100
METRIC RATING
195th/ 347
METRIC RANK
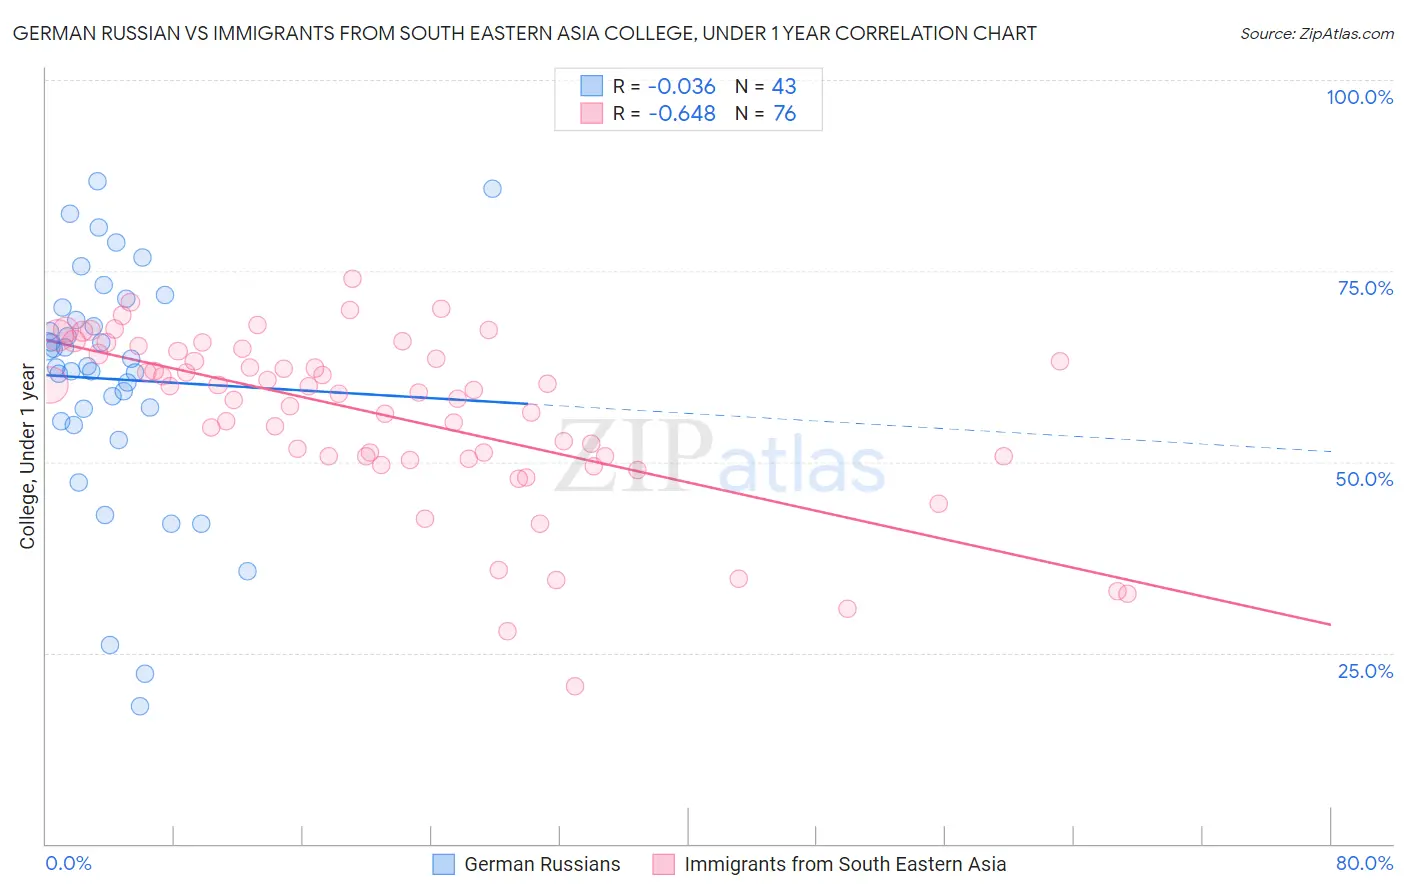
German Russian vs Immigrants from South Eastern Asia College, Under 1 year Correlation Chart
The statistical analysis conducted on geographies consisting of 96,461,984 people shows no correlation between the proportion of German Russians and percentage of population with at least college, under 1 year education in the United States with a correlation coefficient (R) of -0.036 and weighted average of 65.4%. Similarly, the statistical analysis conducted on geographies consisting of 512,706,379 people shows a significant negative correlation between the proportion of Immigrants from South Eastern Asia and percentage of population with at least college, under 1 year education in the United States with a correlation coefficient (R) of -0.648 and weighted average of 64.5%, a difference of 1.3%.
College, Under 1 year Correlation Summary
| Measurement | German Russian | Immigrants from South Eastern Asia |
| Minimum | 18.0% | 20.7% |
| Maximum | 86.7% | 74.1% |
| Range | 68.7% | 53.4% |
| Mean | 60.8% | 56.1% |
| Median | 62.5% | 59.2% |
| Interquartile 25% (IQ1) | 55.4% | 50.7% |
| Interquartile 75% (IQ3) | 70.2% | 64.3% |
| Interquartile Range (IQR) | 14.8% | 13.7% |
| Standard Deviation (Sample) | 15.6% | 11.2% |
| Standard Deviation (Population) | 15.4% | 11.1% |
Demographics Similar to German Russians and Immigrants from South Eastern Asia by College, Under 1 year
In terms of college, under 1 year, the demographic groups most similar to German Russians are Guamanian/Chamorro (65.4%, a difference of 0.0%), Immigrants from North Macedonia (65.4%, a difference of 0.010%), French (65.4%, a difference of 0.030%), Dutch (65.3%, a difference of 0.10%), and Spaniard (65.3%, a difference of 0.12%). Similarly, the demographic groups most similar to Immigrants from South Eastern Asia are Tongan (64.5%, a difference of 0.050%), Immigrants from Cameroon (64.6%, a difference of 0.16%), Slovak (64.7%, a difference of 0.28%), Immigrants from Thailand (64.7%, a difference of 0.30%), and Immigrants from Armenia (64.7%, a difference of 0.36%).
| Demographics | Rating | Rank | College, Under 1 year |
| French | 48.9 /100 | #176 | Average 65.4% |
| Immigrants | North Macedonia | 48.6 /100 | #177 | Average 65.4% |
| German Russians | 48.3 /100 | #178 | Average 65.4% |
| Guamanians/Chamorros | 48.2 /100 | #179 | Average 65.4% |
| Dutch | 46.1 /100 | #180 | Average 65.3% |
| Spaniards | 45.5 /100 | #181 | Average 65.3% |
| Immigrants | Africa | 44.7 /100 | #182 | Average 65.3% |
| Immigrants | Poland | 42.6 /100 | #183 | Average 65.2% |
| Bermudans | 42.0 /100 | #184 | Average 65.2% |
| Sri Lankans | 41.7 /100 | #185 | Average 65.2% |
| Immigrants | Sierra Leone | 39.7 /100 | #186 | Fair 65.1% |
| Immigrants | Southern Europe | 34.3 /100 | #187 | Fair 64.9% |
| Immigrants | Albania | 32.0 /100 | #188 | Fair 64.9% |
| Spanish | 31.6 /100 | #189 | Fair 64.9% |
| Immigrants | Philippines | 30.1 /100 | #190 | Fair 64.8% |
| Immigrants | Armenia | 28.1 /100 | #191 | Fair 64.7% |
| Immigrants | Thailand | 27.0 /100 | #192 | Fair 64.7% |
| Slovaks | 26.7 /100 | #193 | Fair 64.7% |
| Immigrants | Cameroon | 24.6 /100 | #194 | Fair 64.6% |
| Immigrants | South Eastern Asia | 22.1 /100 | #195 | Fair 64.5% |
| Tongans | 21.2 /100 | #196 | Fair 64.5% |