South American Indian vs Immigrants from Latvia College, 1 year or more
COMPARE
South American Indian
Immigrants from Latvia
College, 1 year or more
College, 1 year or more Comparison
South American Indians
Immigrants from Latvia
60.0%
COLLEGE, 1 YEAR OR MORE
66.9/ 100
METRIC RATING
160th/ 347
METRIC RANK
64.8%
COLLEGE, 1 YEAR OR MORE
99.9/ 100
METRIC RATING
42nd/ 347
METRIC RANK
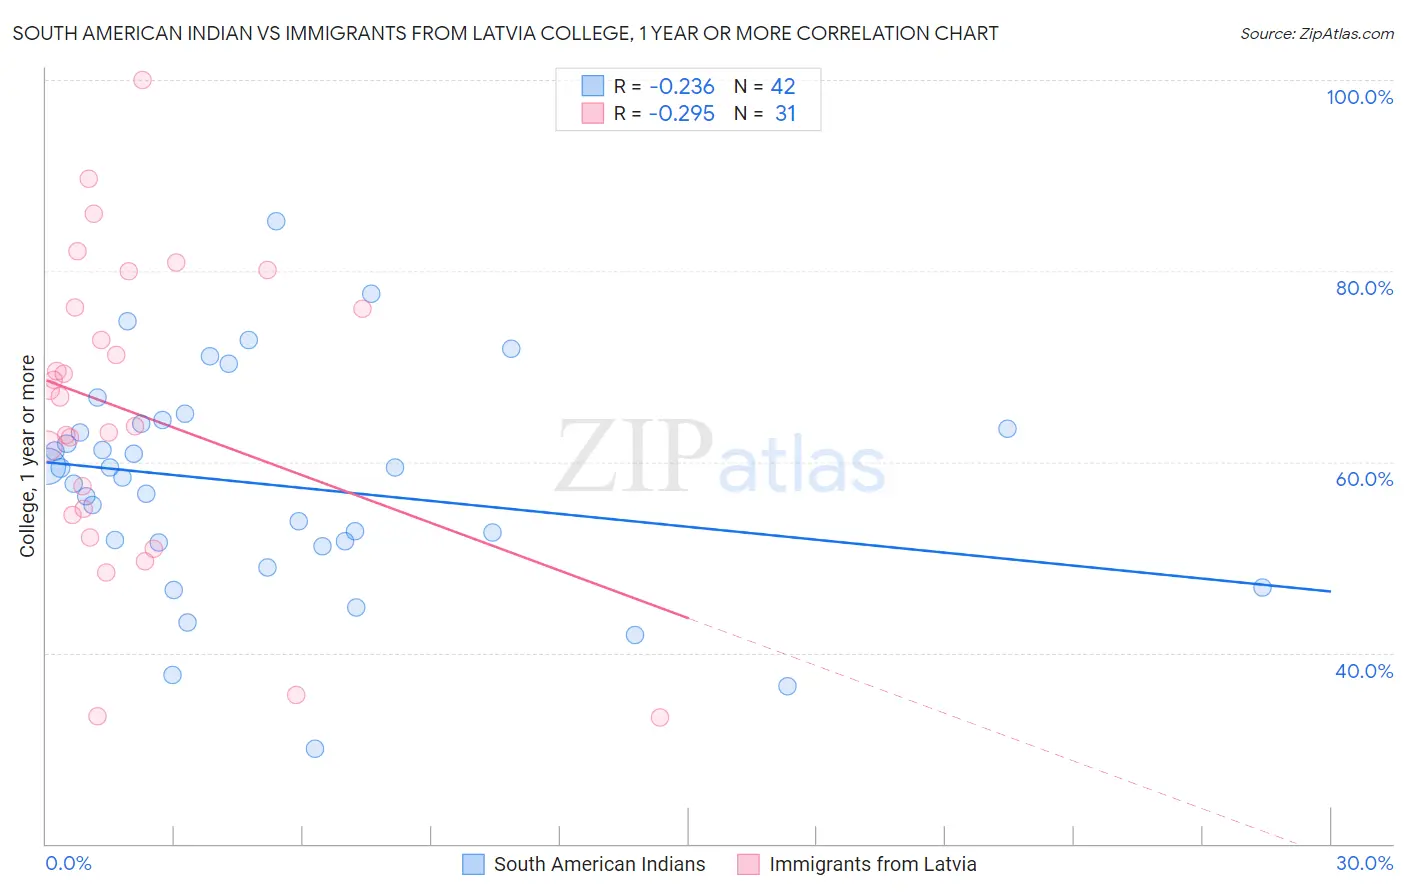
South American Indian vs Immigrants from Latvia College, 1 year or more Correlation Chart
The statistical analysis conducted on geographies consisting of 164,573,280 people shows a weak negative correlation between the proportion of South American Indians and percentage of population with at least college, 1 year or more education in the United States with a correlation coefficient (R) of -0.236 and weighted average of 60.0%. Similarly, the statistical analysis conducted on geographies consisting of 113,735,345 people shows a weak negative correlation between the proportion of Immigrants from Latvia and percentage of population with at least college, 1 year or more education in the United States with a correlation coefficient (R) of -0.295 and weighted average of 64.8%, a difference of 8.1%.
College, 1 year or more Correlation Summary
| Measurement | South American Indian | Immigrants from Latvia |
| Minimum | 30.0% | 33.2% |
| Maximum | 85.2% | 100.0% |
| Range | 55.2% | 66.8% |
| Mean | 57.6% | 65.2% |
| Median | 58.8% | 66.8% |
| Interquartile 25% (IQ1) | 51.6% | 54.4% |
| Interquartile 75% (IQ3) | 63.9% | 76.2% |
| Interquartile Range (IQR) | 12.3% | 21.8% |
| Standard Deviation (Sample) | 11.4% | 16.0% |
| Standard Deviation (Population) | 11.3% | 15.8% |
Similar Demographics by College, 1 year or more
Demographics Similar to South American Indians by College, 1 year or more
In terms of college, 1 year or more, the demographic groups most similar to South American Indians are Immigrants from Iraq (60.0%, a difference of 0.010%), English (60.0%, a difference of 0.020%), Immigrants from Armenia (60.0%, a difference of 0.12%), Somali (59.9%, a difference of 0.14%), and Sudanese (60.2%, a difference of 0.38%).
| Demographics | Rating | Rank | College, 1 year or more |
| Sierra Leoneans | 74.1 /100 | #153 | Good 60.2% |
| Sudanese | 73.0 /100 | #154 | Good 60.2% |
| Moroccans | 72.9 /100 | #155 | Good 60.2% |
| Finns | 72.9 /100 | #156 | Good 60.2% |
| Immigrants | Armenia | 68.8 /100 | #157 | Good 60.0% |
| English | 67.2 /100 | #158 | Good 60.0% |
| Immigrants | Iraq | 67.0 /100 | #159 | Good 60.0% |
| South American Indians | 66.9 /100 | #160 | Good 60.0% |
| Somalis | 64.5 /100 | #161 | Good 59.9% |
| Koreans | 58.5 /100 | #162 | Average 59.7% |
| Immigrants | Somalia | 58.3 /100 | #163 | Average 59.7% |
| Belgians | 58.1 /100 | #164 | Average 59.7% |
| Irish | 56.1 /100 | #165 | Average 59.6% |
| Immigrants | Africa | 56.1 /100 | #166 | Average 59.6% |
| Immigrants | North Macedonia | 53.1 /100 | #167 | Average 59.5% |
Demographics Similar to Immigrants from Latvia by College, 1 year or more
In terms of college, 1 year or more, the demographic groups most similar to Immigrants from Latvia are Mongolian (64.8%, a difference of 0.010%), Immigrants from Russia (64.7%, a difference of 0.12%), Immigrants from Norway (64.7%, a difference of 0.14%), Immigrants from Kuwait (65.0%, a difference of 0.21%), and Estonian (65.0%, a difference of 0.27%).
| Demographics | Rating | Rank | College, 1 year or more |
| Immigrants | Turkey | 99.9 /100 | #35 | Exceptional 65.2% |
| Immigrants | South Africa | 99.9 /100 | #36 | Exceptional 65.1% |
| Russians | 99.9 /100 | #37 | Exceptional 65.1% |
| Immigrants | Saudi Arabia | 99.9 /100 | #38 | Exceptional 65.0% |
| Estonians | 99.9 /100 | #39 | Exceptional 65.0% |
| Immigrants | Kuwait | 99.9 /100 | #40 | Exceptional 65.0% |
| Mongolians | 99.9 /100 | #41 | Exceptional 64.8% |
| Immigrants | Latvia | 99.9 /100 | #42 | Exceptional 64.8% |
| Immigrants | Russia | 99.9 /100 | #43 | Exceptional 64.7% |
| Immigrants | Norway | 99.9 /100 | #44 | Exceptional 64.7% |
| Immigrants | Lithuania | 99.9 /100 | #45 | Exceptional 64.6% |
| Bhutanese | 99.9 /100 | #46 | Exceptional 64.6% |
| Australians | 99.9 /100 | #47 | Exceptional 64.6% |
| Immigrants | Bulgaria | 99.9 /100 | #48 | Exceptional 64.6% |
| New Zealanders | 99.9 /100 | #49 | Exceptional 64.6% |