Immigrants from Asia vs Immigrants from Ghana No Schooling Completed
COMPARE
Immigrants from Asia
Immigrants from Ghana
No Schooling Completed
No Schooling Completed Comparison
Immigrants from Asia
Immigrants from Ghana
2.4%
NO SCHOOLING COMPLETED
0.9/ 100
METRIC RATING
253rd/ 347
METRIC RANK
2.6%
NO SCHOOLING COMPLETED
0.1/ 100
METRIC RATING
282nd/ 347
METRIC RANK
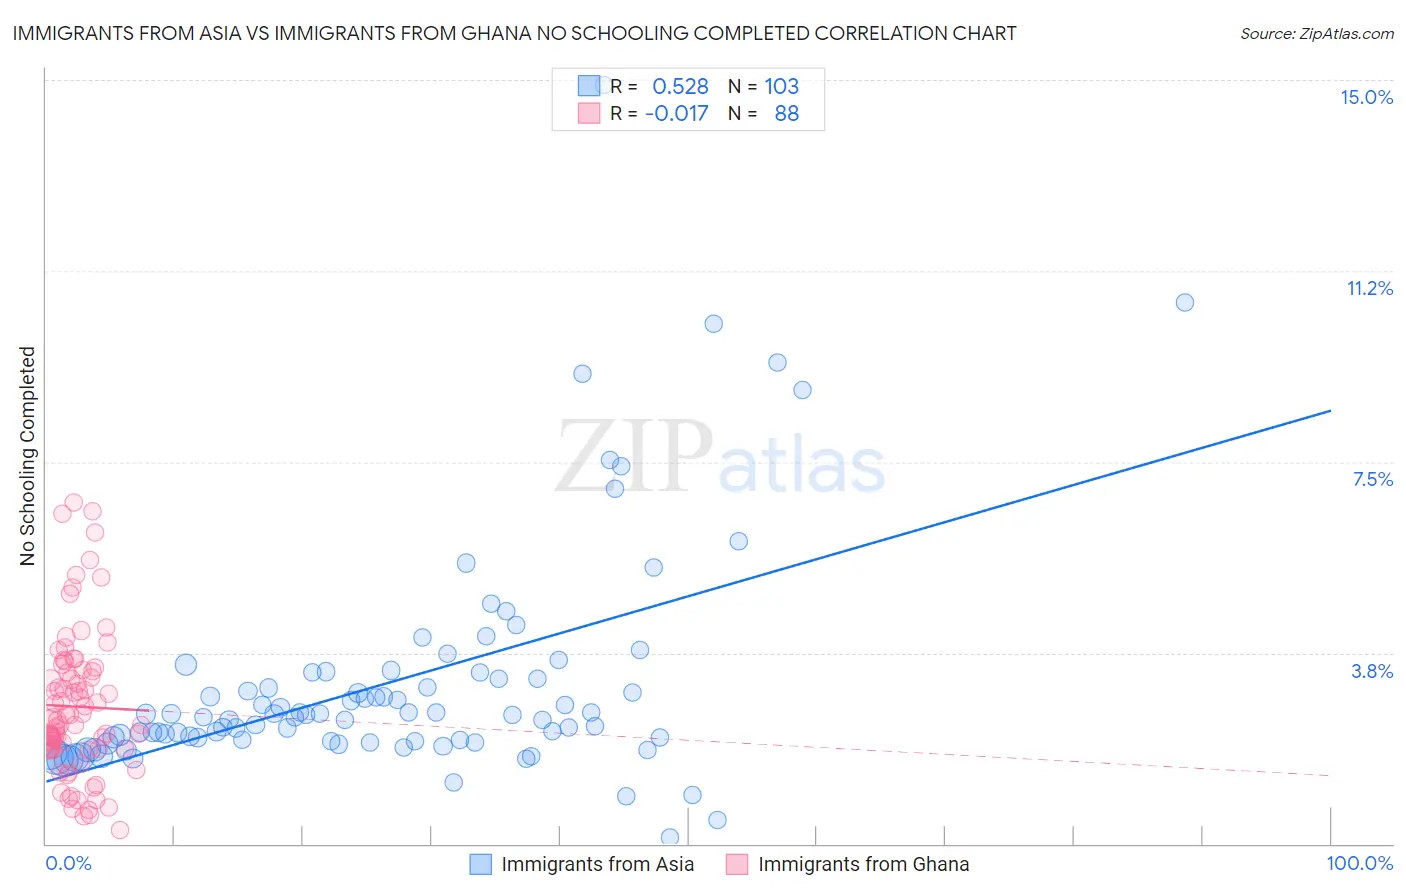
Immigrants from Asia vs Immigrants from Ghana No Schooling Completed Correlation Chart
The statistical analysis conducted on geographies consisting of 536,190,509 people shows a substantial positive correlation between the proportion of Immigrants from Asia and percentage of population with no schooling in the United States with a correlation coefficient (R) of 0.528 and weighted average of 2.4%. Similarly, the statistical analysis conducted on geographies consisting of 198,994,928 people shows no correlation between the proportion of Immigrants from Ghana and percentage of population with no schooling in the United States with a correlation coefficient (R) of -0.017 and weighted average of 2.6%, a difference of 7.7%.
No Schooling Completed Correlation Summary
| Measurement | Immigrants from Asia | Immigrants from Ghana |
| Minimum | 0.13% | 0.26% |
| Maximum | 14.9% | 6.7% |
| Range | 14.8% | 6.5% |
| Mean | 3.1% | 2.7% |
| Median | 2.5% | 2.5% |
| Interquartile 25% (IQ1) | 2.0% | 1.9% |
| Interquartile 75% (IQ3) | 3.2% | 3.4% |
| Interquartile Range (IQR) | 1.2% | 1.6% |
| Standard Deviation (Sample) | 2.3% | 1.4% |
| Standard Deviation (Population) | 2.3% | 1.4% |
Similar Demographics by No Schooling Completed
Demographics Similar to Immigrants from Asia by No Schooling Completed
In terms of no schooling completed, the demographic groups most similar to Immigrants from Asia are Immigrants from Colombia (2.4%, a difference of 0.13%), Immigrants from Eastern Africa (2.4%, a difference of 0.13%), Ethiopian (2.4%, a difference of 0.33%), Yaqui (2.4%, a difference of 0.50%), and Immigrants from Africa (2.4%, a difference of 0.57%).
| Demographics | Rating | Rank | No Schooling Completed |
| Immigrants | Congo | 1.4 /100 | #246 | Tragic 2.4% |
| Immigrants | Iraq | 1.3 /100 | #247 | Tragic 2.4% |
| Asians | 1.2 /100 | #248 | Tragic 2.4% |
| Jamaicans | 1.2 /100 | #249 | Tragic 2.4% |
| Immigrants | Middle Africa | 1.1 /100 | #250 | Tragic 2.4% |
| Immigrants | Africa | 1.1 /100 | #251 | Tragic 2.4% |
| Immigrants | Colombia | 1.0 /100 | #252 | Tragic 2.4% |
| Immigrants | Asia | 0.9 /100 | #253 | Tragic 2.4% |
| Immigrants | Eastern Africa | 0.9 /100 | #254 | Tragic 2.4% |
| Ethiopians | 0.8 /100 | #255 | Tragic 2.4% |
| Yaqui | 0.8 /100 | #256 | Tragic 2.4% |
| Immigrants | South America | 0.6 /100 | #257 | Tragic 2.5% |
| Assyrians/Chaldeans/Syriacs | 0.6 /100 | #258 | Tragic 2.5% |
| Immigrants | Jamaica | 0.6 /100 | #259 | Tragic 2.5% |
| Immigrants | Ethiopia | 0.6 /100 | #260 | Tragic 2.5% |
Demographics Similar to Immigrants from Ghana by No Schooling Completed
In terms of no schooling completed, the demographic groups most similar to Immigrants from Ghana are Afghan (2.6%, a difference of 0.20%), Trinidadian and Tobagonian (2.6%, a difference of 0.28%), Barbadian (2.6%, a difference of 0.30%), Immigrants from Uzbekistan (2.6%, a difference of 0.85%), and Immigrants from Philippines (2.6%, a difference of 1.1%).
| Demographics | Rating | Rank | No Schooling Completed |
| Immigrants | China | 0.1 /100 | #275 | Tragic 2.6% |
| Immigrants | Western Africa | 0.1 /100 | #276 | Tragic 2.6% |
| Immigrants | Philippines | 0.1 /100 | #277 | Tragic 2.6% |
| Immigrants | Uzbekistan | 0.1 /100 | #278 | Tragic 2.6% |
| Barbadians | 0.1 /100 | #279 | Tragic 2.6% |
| Trinidadians and Tobagonians | 0.1 /100 | #280 | Tragic 2.6% |
| Afghans | 0.1 /100 | #281 | Tragic 2.6% |
| Immigrants | Ghana | 0.1 /100 | #282 | Tragic 2.6% |
| Immigrants | Trinidad and Tobago | 0.0 /100 | #283 | Tragic 2.6% |
| Immigrants | West Indies | 0.0 /100 | #284 | Tragic 2.7% |
| Immigrants | Barbados | 0.0 /100 | #285 | Tragic 2.7% |
| Immigrants | Portugal | 0.0 /100 | #286 | Tragic 2.7% |
| Immigrants | Afghanistan | 0.0 /100 | #287 | Tragic 2.7% |
| Immigrants | St. Vincent and the Grenadines | 0.0 /100 | #288 | Tragic 2.7% |
| Immigrants | Thailand | 0.0 /100 | #289 | Tragic 2.7% |