Immigrants from Chile vs Immigrants from Ghana No Schooling Completed
COMPARE
Immigrants from Chile
Immigrants from Ghana
No Schooling Completed
No Schooling Completed Comparison
Immigrants from Chile
Immigrants from Ghana
2.2%
NO SCHOOLING COMPLETED
22.7/ 100
METRIC RATING
198th/ 347
METRIC RANK
2.6%
NO SCHOOLING COMPLETED
0.1/ 100
METRIC RATING
282nd/ 347
METRIC RANK
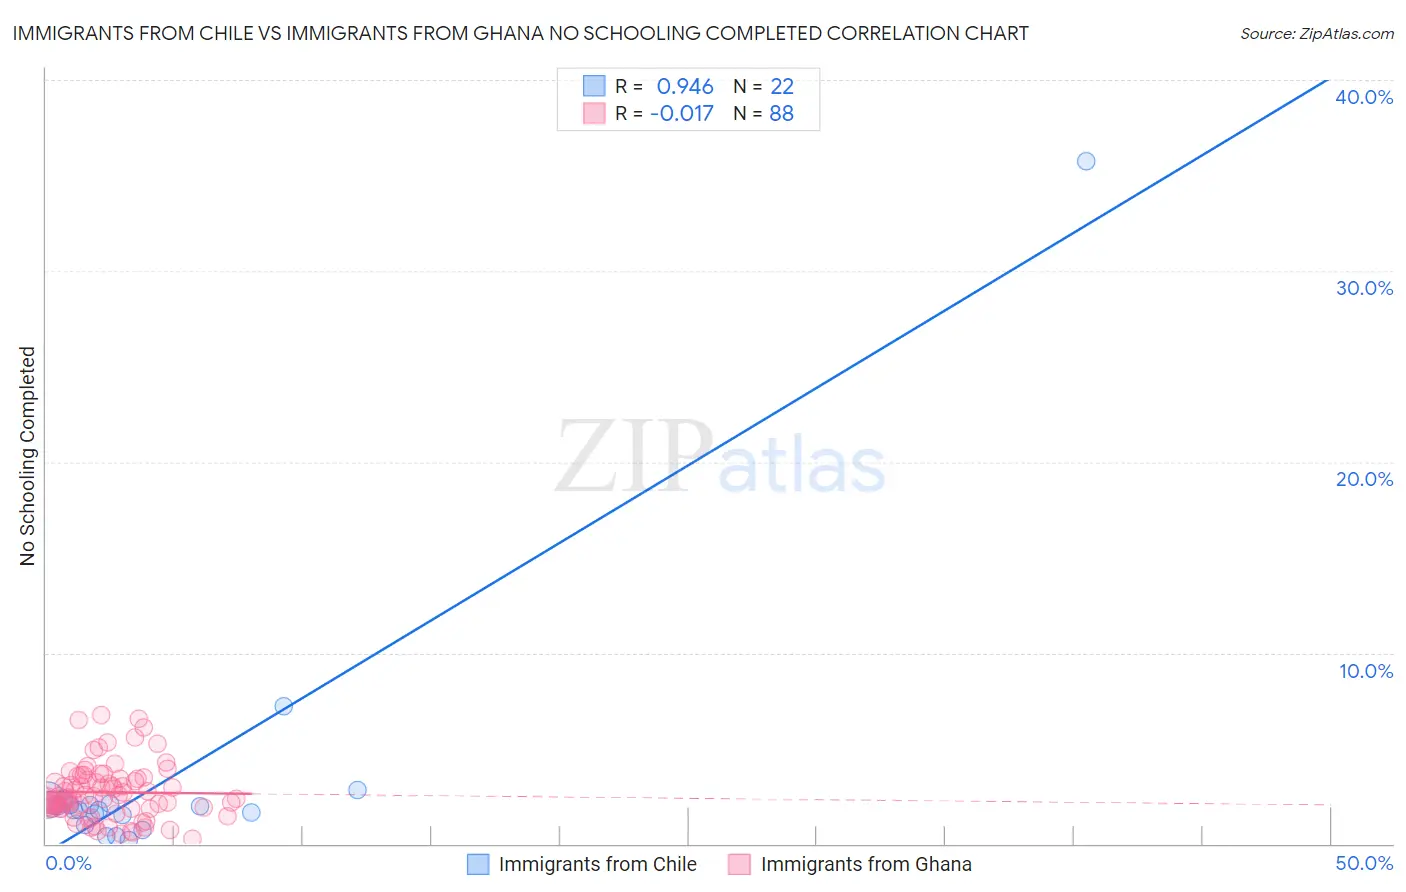
Immigrants from Chile vs Immigrants from Ghana No Schooling Completed Correlation Chart
The statistical analysis conducted on geographies consisting of 217,752,126 people shows a near-perfect positive correlation between the proportion of Immigrants from Chile and percentage of population with no schooling in the United States with a correlation coefficient (R) of 0.946 and weighted average of 2.2%. Similarly, the statistical analysis conducted on geographies consisting of 198,994,928 people shows no correlation between the proportion of Immigrants from Ghana and percentage of population with no schooling in the United States with a correlation coefficient (R) of -0.017 and weighted average of 2.6%, a difference of 19.7%.
No Schooling Completed Correlation Summary
| Measurement | Immigrants from Chile | Immigrants from Ghana |
| Minimum | 0.21% | 0.26% |
| Maximum | 35.7% | 6.7% |
| Range | 35.5% | 6.5% |
| Mean | 3.4% | 2.7% |
| Median | 1.9% | 2.5% |
| Interquartile 25% (IQ1) | 1.5% | 1.9% |
| Interquartile 75% (IQ3) | 2.1% | 3.4% |
| Interquartile Range (IQR) | 0.53% | 1.6% |
| Standard Deviation (Sample) | 7.3% | 1.4% |
| Standard Deviation (Population) | 7.2% | 1.4% |
Similar Demographics by No Schooling Completed
Demographics Similar to Immigrants from Chile by No Schooling Completed
In terms of no schooling completed, the demographic groups most similar to Immigrants from Chile are African (2.2%, a difference of 0.17%), Immigrants from Southern Europe (2.2%, a difference of 0.18%), Immigrants from Ukraine (2.2%, a difference of 0.60%), Immigrants from Northern Africa (2.2%, a difference of 0.64%), and Hawaiian (2.2%, a difference of 0.75%).
| Demographics | Rating | Rank | No Schooling Completed |
| Bermudans | 30.7 /100 | #191 | Fair 2.1% |
| Guamanians/Chamorros | 29.8 /100 | #192 | Fair 2.2% |
| Paraguayans | 29.3 /100 | #193 | Fair 2.2% |
| Immigrants | Albania | 28.3 /100 | #194 | Fair 2.2% |
| Hawaiians | 27.0 /100 | #195 | Fair 2.2% |
| Immigrants | Ukraine | 26.1 /100 | #196 | Fair 2.2% |
| Immigrants | Southern Europe | 23.8 /100 | #197 | Fair 2.2% |
| Immigrants | Chile | 22.7 /100 | #198 | Fair 2.2% |
| Africans | 21.8 /100 | #199 | Fair 2.2% |
| Immigrants | Northern Africa | 19.5 /100 | #200 | Poor 2.2% |
| Costa Ricans | 17.1 /100 | #201 | Poor 2.2% |
| Moroccans | 13.7 /100 | #202 | Poor 2.2% |
| Laotians | 13.3 /100 | #203 | Poor 2.2% |
| Hopi | 12.9 /100 | #204 | Poor 2.2% |
| Immigrants | Bahamas | 11.6 /100 | #205 | Poor 2.2% |
Demographics Similar to Immigrants from Ghana by No Schooling Completed
In terms of no schooling completed, the demographic groups most similar to Immigrants from Ghana are Afghan (2.6%, a difference of 0.20%), Trinidadian and Tobagonian (2.6%, a difference of 0.28%), Barbadian (2.6%, a difference of 0.30%), Immigrants from Uzbekistan (2.6%, a difference of 0.85%), and Immigrants from Philippines (2.6%, a difference of 1.1%).
| Demographics | Rating | Rank | No Schooling Completed |
| Immigrants | China | 0.1 /100 | #275 | Tragic 2.6% |
| Immigrants | Western Africa | 0.1 /100 | #276 | Tragic 2.6% |
| Immigrants | Philippines | 0.1 /100 | #277 | Tragic 2.6% |
| Immigrants | Uzbekistan | 0.1 /100 | #278 | Tragic 2.6% |
| Barbadians | 0.1 /100 | #279 | Tragic 2.6% |
| Trinidadians and Tobagonians | 0.1 /100 | #280 | Tragic 2.6% |
| Afghans | 0.1 /100 | #281 | Tragic 2.6% |
| Immigrants | Ghana | 0.1 /100 | #282 | Tragic 2.6% |
| Immigrants | Trinidad and Tobago | 0.0 /100 | #283 | Tragic 2.6% |
| Immigrants | West Indies | 0.0 /100 | #284 | Tragic 2.7% |
| Immigrants | Barbados | 0.0 /100 | #285 | Tragic 2.7% |
| Immigrants | Portugal | 0.0 /100 | #286 | Tragic 2.7% |
| Immigrants | Afghanistan | 0.0 /100 | #287 | Tragic 2.7% |
| Immigrants | St. Vincent and the Grenadines | 0.0 /100 | #288 | Tragic 2.7% |
| Immigrants | Thailand | 0.0 /100 | #289 | Tragic 2.7% |