Puget Sound Salish vs Immigrants from Ecuador No Schooling Completed
COMPARE
Puget Sound Salish
Immigrants from Ecuador
No Schooling Completed
No Schooling Completed Comparison
Puget Sound Salish
Immigrants from Ecuador
1.8%
NO SCHOOLING COMPLETED
98.5/ 100
METRIC RATING
95th/ 347
METRIC RANK
3.1%
NO SCHOOLING COMPLETED
0.0/ 100
METRIC RATING
316th/ 347
METRIC RANK
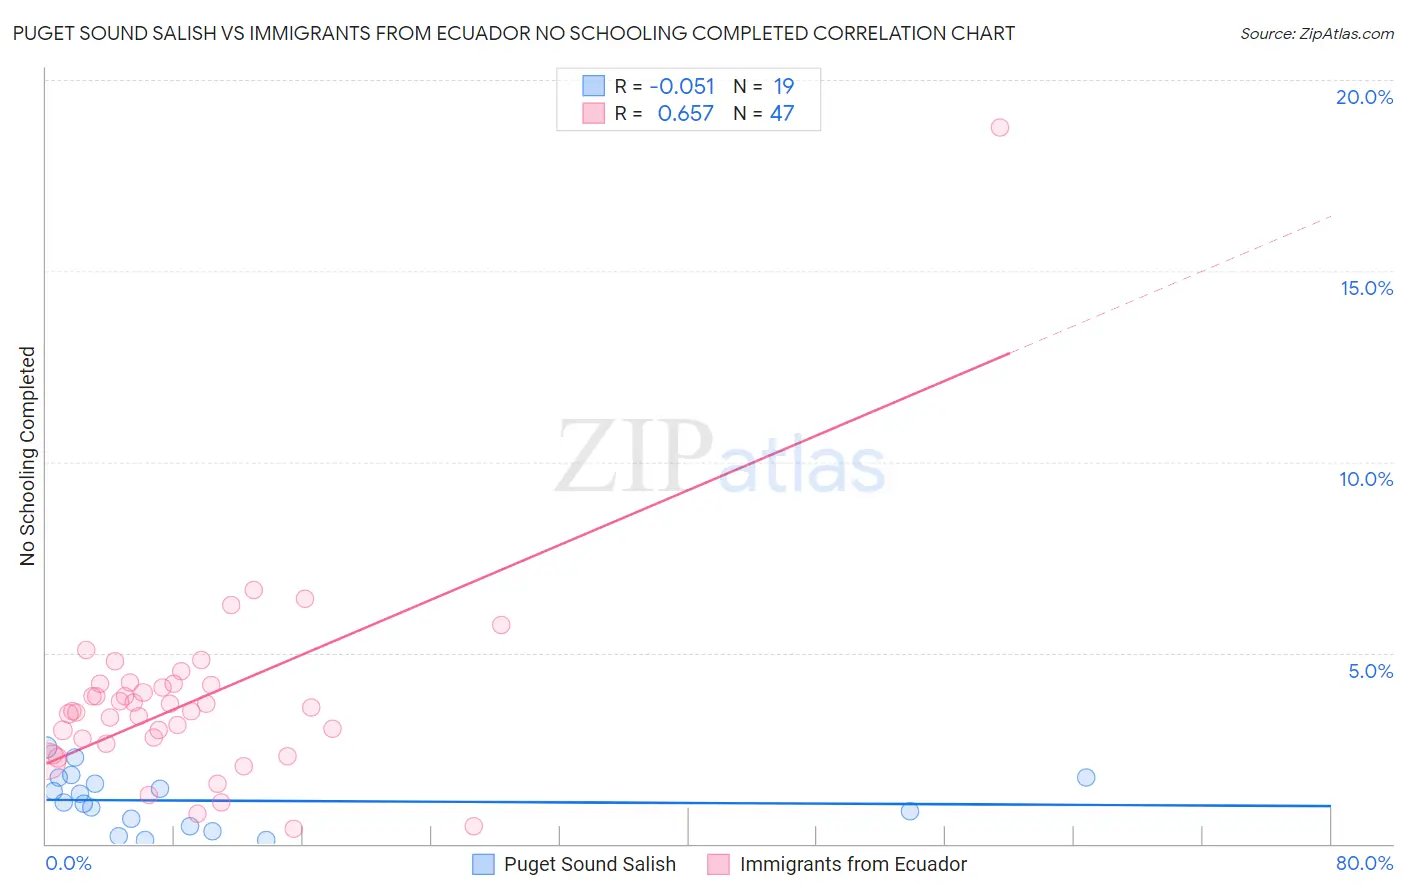
Puget Sound Salish vs Immigrants from Ecuador No Schooling Completed Correlation Chart
The statistical analysis conducted on geographies consisting of 45,937,154 people shows a slight negative correlation between the proportion of Puget Sound Salish and percentage of population with no schooling in the United States with a correlation coefficient (R) of -0.051 and weighted average of 1.8%. Similarly, the statistical analysis conducted on geographies consisting of 269,548,535 people shows a significant positive correlation between the proportion of Immigrants from Ecuador and percentage of population with no schooling in the United States with a correlation coefficient (R) of 0.657 and weighted average of 3.1%, a difference of 71.7%.
No Schooling Completed Correlation Summary
| Measurement | Puget Sound Salish | Immigrants from Ecuador |
| Minimum | 0.082% | 0.40% |
| Maximum | 2.5% | 18.8% |
| Range | 2.4% | 18.3% |
| Mean | 1.1% | 3.7% |
| Median | 1.1% | 3.5% |
| Interquartile 25% (IQ1) | 0.45% | 2.6% |
| Interquartile 75% (IQ3) | 1.7% | 4.2% |
| Interquartile Range (IQR) | 1.3% | 1.5% |
| Standard Deviation (Sample) | 0.72% | 2.6% |
| Standard Deviation (Population) | 0.70% | 2.6% |
Similar Demographics by No Schooling Completed
Demographics Similar to Puget Sound Salish by No Schooling Completed
In terms of no schooling completed, the demographic groups most similar to Puget Sound Salish are Nonimmigrants (1.8%, a difference of 0.010%), Bhutanese (1.8%, a difference of 0.23%), Immigrants from Ireland (1.8%, a difference of 0.41%), Turkish (1.8%, a difference of 0.51%), and Iranian (1.8%, a difference of 0.69%).
| Demographics | Rating | Rank | No Schooling Completed |
| Immigrants | Western Europe | 99.2 /100 | #88 | Exceptional 1.8% |
| South Africans | 99.1 /100 | #89 | Exceptional 1.8% |
| Sioux | 99.0 /100 | #90 | Exceptional 1.8% |
| Immigrants | Germany | 99.0 /100 | #91 | Exceptional 1.8% |
| Romanians | 98.8 /100 | #92 | Exceptional 1.8% |
| Turks | 98.7 /100 | #93 | Exceptional 1.8% |
| Immigrants | Nonimmigrants | 98.5 /100 | #94 | Exceptional 1.8% |
| Puget Sound Salish | 98.5 /100 | #95 | Exceptional 1.8% |
| Bhutanese | 98.4 /100 | #96 | Exceptional 1.8% |
| Immigrants | Ireland | 98.4 /100 | #97 | Exceptional 1.8% |
| Iranians | 98.2 /100 | #98 | Exceptional 1.8% |
| Choctaw | 98.1 /100 | #99 | Exceptional 1.8% |
| Immigrants | Singapore | 98.0 /100 | #100 | Exceptional 1.8% |
| Immigrants | Czechoslovakia | 97.9 /100 | #101 | Exceptional 1.8% |
| Immigrants | Switzerland | 97.9 /100 | #102 | Exceptional 1.8% |
Demographics Similar to Immigrants from Ecuador by No Schooling Completed
In terms of no schooling completed, the demographic groups most similar to Immigrants from Ecuador are Immigrants from Nicaragua (3.1%, a difference of 0.36%), Cape Verdean (3.1%, a difference of 0.49%), Immigrants from Belize (3.1%, a difference of 0.60%), Honduran (3.1%, a difference of 0.69%), and Immigrants from Guyana (3.1%, a difference of 1.2%).
| Demographics | Rating | Rank | No Schooling Completed |
| Hispanics or Latinos | 0.0 /100 | #309 | Tragic 3.0% |
| Guyanese | 0.0 /100 | #310 | Tragic 3.0% |
| Immigrants | Azores | 0.0 /100 | #311 | Tragic 3.0% |
| Sri Lankans | 0.0 /100 | #312 | Tragic 3.0% |
| Hondurans | 0.0 /100 | #313 | Tragic 3.1% |
| Immigrants | Belize | 0.0 /100 | #314 | Tragic 3.1% |
| Immigrants | Nicaragua | 0.0 /100 | #315 | Tragic 3.1% |
| Immigrants | Ecuador | 0.0 /100 | #316 | Tragic 3.1% |
| Cape Verdeans | 0.0 /100 | #317 | Tragic 3.1% |
| Immigrants | Guyana | 0.0 /100 | #318 | Tragic 3.1% |
| Immigrants | Burma/Myanmar | 0.0 /100 | #319 | Tragic 3.1% |
| Immigrants | Bangladesh | 0.0 /100 | #320 | Tragic 3.1% |
| Immigrants | Laos | 0.0 /100 | #321 | Tragic 3.1% |
| Immigrants | Honduras | 0.0 /100 | #322 | Tragic 3.2% |
| Vietnamese | 0.0 /100 | #323 | Tragic 3.2% |