Finnish vs Immigrants from Costa Rica 7th Grade
COMPARE
Finnish
Immigrants from Costa Rica
7th Grade
7th Grade Comparison
Finns
Immigrants from Costa Rica
98.5%
7TH GRADE
100.0/ 100
METRIC RATING
2nd/ 347
METRIC RANK
95.3%
7TH GRADE
0.6/ 100
METRIC RATING
259th/ 347
METRIC RANK
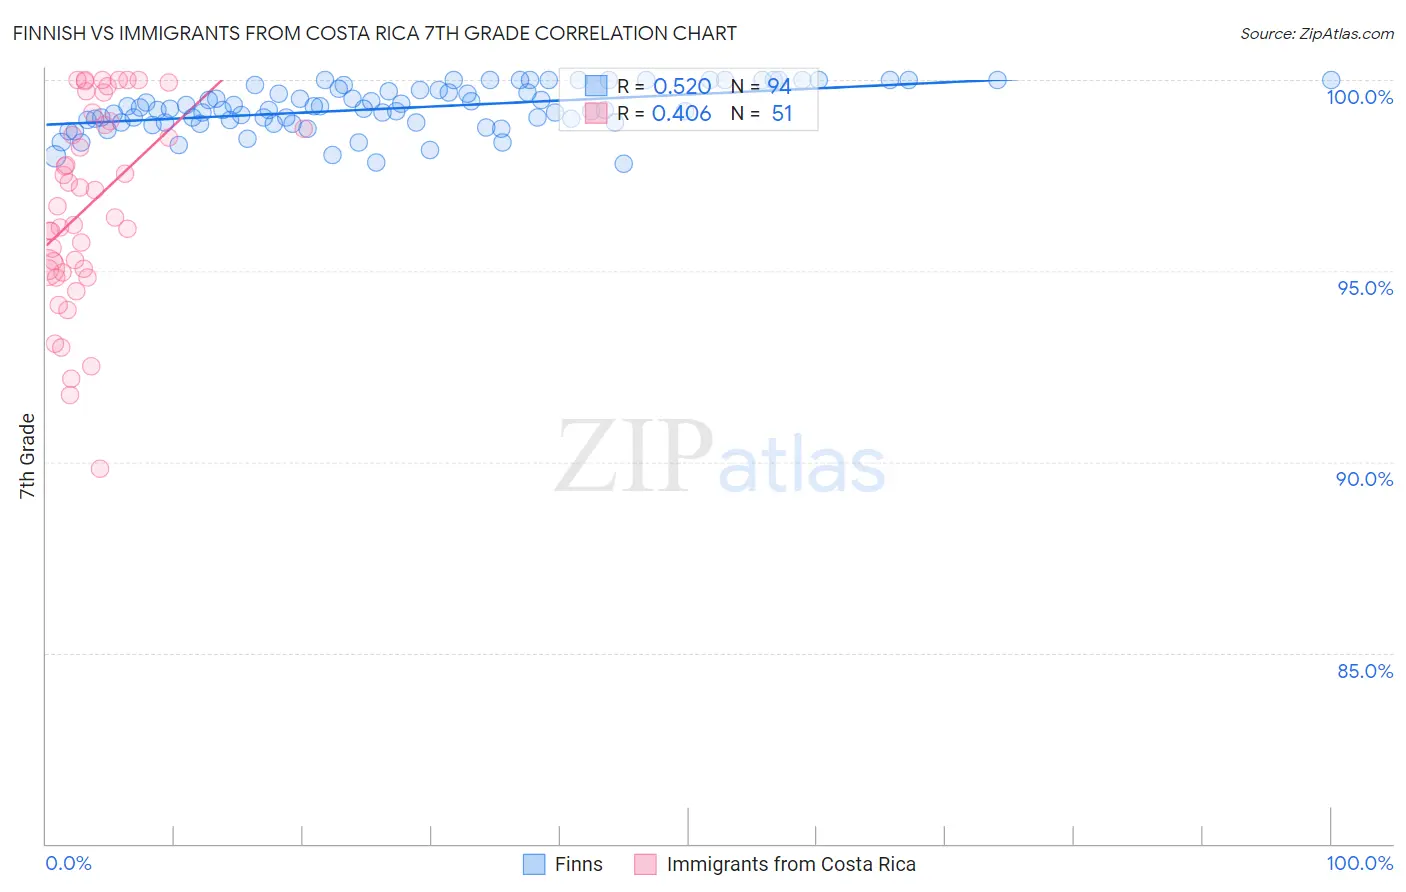
Finnish vs Immigrants from Costa Rica 7th Grade Correlation Chart
The statistical analysis conducted on geographies consisting of 46,909,556 people shows a substantial positive correlation between the proportion of Finns and percentage of population with at least 7th grade education in the United States with a correlation coefficient (R) of 0.520 and weighted average of 98.5%. Similarly, the statistical analysis conducted on geographies consisting of 204,272,182 people shows a moderate positive correlation between the proportion of Immigrants from Costa Rica and percentage of population with at least 7th grade education in the United States with a correlation coefficient (R) of 0.406 and weighted average of 95.3%, a difference of 3.4%.
7th Grade Correlation Summary
| Measurement | Finnish | Immigrants from Costa Rica |
| Minimum | 97.8% | 89.8% |
| Maximum | 100.0% | 100.0% |
| Range | 2.2% | 10.2% |
| Mean | 99.3% | 96.7% |
| Median | 99.2% | 96.7% |
| Interquartile 25% (IQ1) | 98.9% | 95.0% |
| Interquartile 75% (IQ3) | 99.7% | 98.9% |
| Interquartile Range (IQR) | 0.85% | 3.9% |
| Standard Deviation (Sample) | 0.57% | 2.6% |
| Standard Deviation (Population) | 0.57% | 2.5% |
Similar Demographics by 7th Grade
Demographics Similar to Finns by 7th Grade
In terms of 7th grade, the demographic groups most similar to Finns are Carpatho Rusyn (98.3%, a difference of 0.18%), Ottawa (98.1%, a difference of 0.37%), Dutch (97.9%, a difference of 0.64%), Crow (99.1%, a difference of 0.65%), and Tsimshian (97.8%, a difference of 0.71%).
| Demographics | Rating | Rank | 7th Grade |
| Crow | 100.0 /100 | #1 | Exceptional 99.1% |
| Finns | 100.0 /100 | #2 | Exceptional 98.5% |
| Carpatho Rusyns | 100.0 /100 | #3 | Exceptional 98.3% |
| Ottawa | 100.0 /100 | #4 | Exceptional 98.1% |
| Dutch | 100.0 /100 | #5 | Exceptional 97.9% |
| Tsimshian | 100.0 /100 | #6 | Exceptional 97.8% |
| Norwegians | 100.0 /100 | #7 | Exceptional 97.8% |
| Slovaks | 100.0 /100 | #8 | Exceptional 97.8% |
| Germans | 100.0 /100 | #9 | Exceptional 97.7% |
| Slovenes | 100.0 /100 | #10 | Exceptional 97.6% |
| Alaskan Athabascans | 100.0 /100 | #11 | Exceptional 97.6% |
| Poles | 100.0 /100 | #12 | Exceptional 97.6% |
| Swedes | 100.0 /100 | #13 | Exceptional 97.6% |
| Pennsylvania Germans | 100.0 /100 | #14 | Exceptional 97.6% |
| English | 100.0 /100 | #15 | Exceptional 97.6% |
Demographics Similar to Immigrants from Costa Rica by 7th Grade
In terms of 7th grade, the demographic groups most similar to Immigrants from Costa Rica are Immigrants from China (95.3%, a difference of 0.030%), Immigrants from Congo (95.3%, a difference of 0.030%), Ghanaian (95.3%, a difference of 0.030%), Afghan (95.3%, a difference of 0.030%), and Korean (95.3%, a difference of 0.040%).
| Demographics | Rating | Rank | 7th Grade |
| Immigrants | Ethiopia | 0.9 /100 | #252 | Tragic 95.3% |
| Somalis | 0.9 /100 | #253 | Tragic 95.3% |
| Colombians | 0.8 /100 | #254 | Tragic 95.3% |
| Koreans | 0.8 /100 | #255 | Tragic 95.3% |
| Immigrants | China | 0.7 /100 | #256 | Tragic 95.3% |
| Immigrants | Congo | 0.7 /100 | #257 | Tragic 95.3% |
| Ghanaians | 0.7 /100 | #258 | Tragic 95.3% |
| Immigrants | Costa Rica | 0.6 /100 | #259 | Tragic 95.3% |
| Afghans | 0.5 /100 | #260 | Tragic 95.3% |
| South Americans | 0.5 /100 | #261 | Tragic 95.2% |
| Immigrants | Somalia | 0.5 /100 | #262 | Tragic 95.2% |
| West Indians | 0.5 /100 | #263 | Tragic 95.2% |
| Immigrants | Nigeria | 0.4 /100 | #264 | Tragic 95.2% |
| Immigrants | Uruguay | 0.3 /100 | #265 | Tragic 95.2% |
| Immigrants | Ghana | 0.3 /100 | #266 | Tragic 95.2% |