Ethiopian vs Puget Sound Salish Master's Degree
COMPARE
Ethiopian
Puget Sound Salish
Master's Degree
Master's Degree Comparison
Ethiopians
Puget Sound Salish
18.0%
MASTER'S DEGREE
99.8/ 100
METRIC RATING
66th/ 347
METRIC RANK
11.1%
MASTER'S DEGREE
0.0/ 100
METRIC RATING
309th/ 347
METRIC RANK
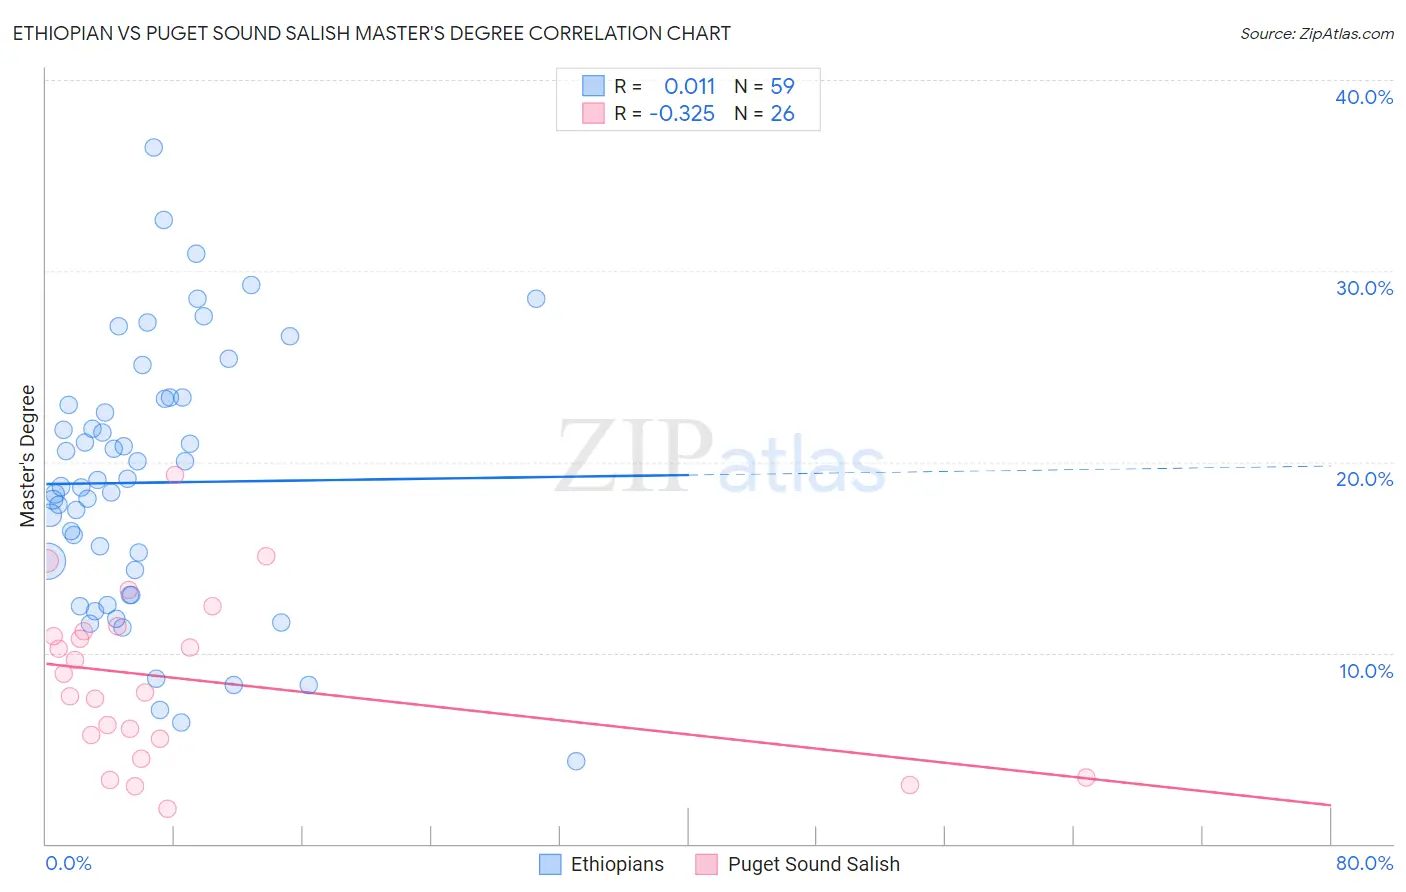
Ethiopian vs Puget Sound Salish Master's Degree Correlation Chart
The statistical analysis conducted on geographies consisting of 223,155,116 people shows no correlation between the proportion of Ethiopians and percentage of population with at least master's degree education in the United States with a correlation coefficient (R) of 0.011 and weighted average of 18.0%. Similarly, the statistical analysis conducted on geographies consisting of 46,155,292 people shows a mild negative correlation between the proportion of Puget Sound Salish and percentage of population with at least master's degree education in the United States with a correlation coefficient (R) of -0.325 and weighted average of 11.1%, a difference of 61.4%.
Master's Degree Correlation Summary
| Measurement | Ethiopian | Puget Sound Salish |
| Minimum | 4.3% | 1.9% |
| Maximum | 36.4% | 19.3% |
| Range | 32.1% | 17.5% |
| Mean | 18.9% | 8.6% |
| Median | 18.7% | 8.4% |
| Interquartile 25% (IQ1) | 13.1% | 5.5% |
| Interquartile 75% (IQ3) | 23.3% | 11.1% |
| Interquartile Range (IQR) | 10.2% | 5.6% |
| Standard Deviation (Sample) | 6.9% | 4.4% |
| Standard Deviation (Population) | 6.8% | 4.3% |
Similar Demographics by Master's Degree
Demographics Similar to Ethiopians by Master's Degree
In terms of master's degree, the demographic groups most similar to Ethiopians are Immigrants from Kazakhstan (18.0%, a difference of 0.020%), Immigrants from Argentina (18.0%, a difference of 0.050%), Immigrants from Ethiopia (17.9%, a difference of 0.27%), Immigrants from Uzbekistan (17.9%, a difference of 0.60%), and South African (18.1%, a difference of 0.73%).
| Demographics | Rating | Rank | Master's Degree |
| Immigrants | Bulgaria | 99.9 /100 | #59 | Exceptional 18.3% |
| New Zealanders | 99.9 /100 | #60 | Exceptional 18.3% |
| Immigrants | Europe | 99.9 /100 | #61 | Exceptional 18.2% |
| Argentineans | 99.9 /100 | #62 | Exceptional 18.2% |
| Immigrants | Netherlands | 99.9 /100 | #63 | Exceptional 18.1% |
| South Africans | 99.9 /100 | #64 | Exceptional 18.1% |
| Immigrants | Kazakhstan | 99.8 /100 | #65 | Exceptional 18.0% |
| Ethiopians | 99.8 /100 | #66 | Exceptional 18.0% |
| Immigrants | Argentina | 99.8 /100 | #67 | Exceptional 18.0% |
| Immigrants | Ethiopia | 99.8 /100 | #68 | Exceptional 17.9% |
| Immigrants | Uzbekistan | 99.8 /100 | #69 | Exceptional 17.9% |
| Immigrants | Western Europe | 99.8 /100 | #70 | Exceptional 17.8% |
| Immigrants | Pakistan | 99.7 /100 | #71 | Exceptional 17.8% |
| Lithuanians | 99.7 /100 | #72 | Exceptional 17.7% |
| Zimbabweans | 99.7 /100 | #73 | Exceptional 17.7% |
Demographics Similar to Puget Sound Salish by Master's Degree
In terms of master's degree, the demographic groups most similar to Puget Sound Salish are Puerto Rican (11.2%, a difference of 0.29%), Shoshone (11.1%, a difference of 0.36%), Cheyenne (11.2%, a difference of 0.84%), Seminole (11.0%, a difference of 0.87%), and Choctaw (11.0%, a difference of 0.97%).
| Demographics | Rating | Rank | Master's Degree |
| Cherokee | 0.1 /100 | #302 | Tragic 11.4% |
| Immigrants | Laos | 0.1 /100 | #303 | Tragic 11.4% |
| Immigrants | Cabo Verde | 0.1 /100 | #304 | Tragic 11.3% |
| Immigrants | Latin America | 0.0 /100 | #305 | Tragic 11.3% |
| Mexican American Indians | 0.0 /100 | #306 | Tragic 11.2% |
| Cheyenne | 0.0 /100 | #307 | Tragic 11.2% |
| Puerto Ricans | 0.0 /100 | #308 | Tragic 11.2% |
| Puget Sound Salish | 0.0 /100 | #309 | Tragic 11.1% |
| Shoshone | 0.0 /100 | #310 | Tragic 11.1% |
| Seminole | 0.0 /100 | #311 | Tragic 11.0% |
| Choctaw | 0.0 /100 | #312 | Tragic 11.0% |
| Yaqui | 0.0 /100 | #313 | Tragic 11.0% |
| Cajuns | 0.0 /100 | #314 | Tragic 11.0% |
| Apache | 0.0 /100 | #315 | Tragic 11.0% |
| Hispanics or Latinos | 0.0 /100 | #316 | Tragic 10.9% |