Immigrants from Zaire vs Polish Master's Degree
COMPARE
Immigrants from Zaire
Polish
Master's Degree
Master's Degree Comparison
Immigrants from Zaire
Poles
14.7%
MASTER'S DEGREE
39.5/ 100
METRIC RATING
184th/ 347
METRIC RANK
15.7%
MASTER'S DEGREE
85.0/ 100
METRIC RATING
141st/ 347
METRIC RANK
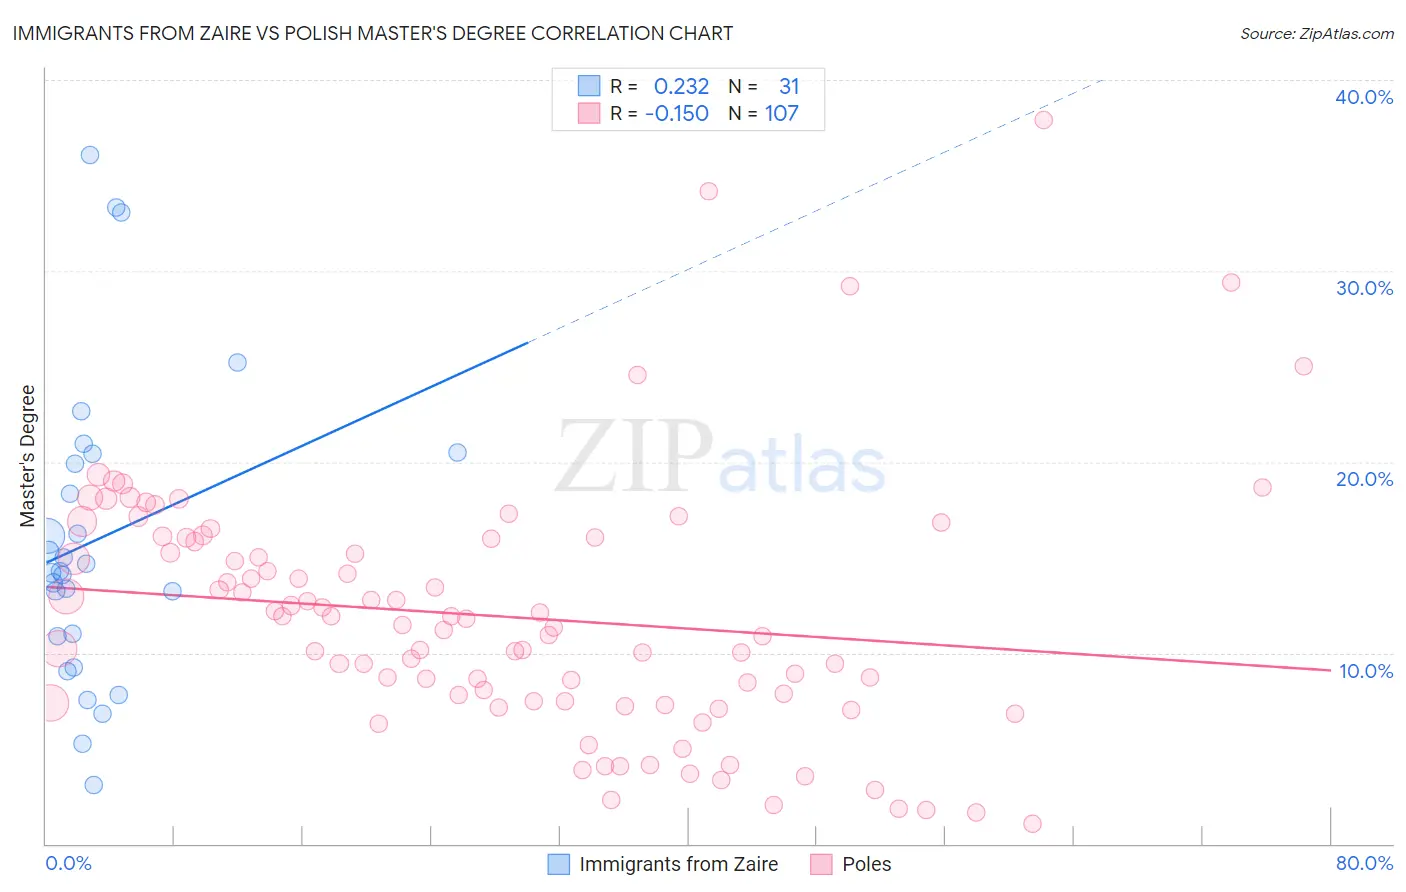
Immigrants from Zaire vs Polish Master's Degree Correlation Chart
The statistical analysis conducted on geographies consisting of 107,246,977 people shows a weak positive correlation between the proportion of Immigrants from Zaire and percentage of population with at least master's degree education in the United States with a correlation coefficient (R) of 0.232 and weighted average of 14.7%. Similarly, the statistical analysis conducted on geographies consisting of 559,882,025 people shows a poor negative correlation between the proportion of Poles and percentage of population with at least master's degree education in the United States with a correlation coefficient (R) of -0.150 and weighted average of 15.7%, a difference of 7.0%.
Master's Degree Correlation Summary
| Measurement | Immigrants from Zaire | Polish |
| Minimum | 3.1% | 1.0% |
| Maximum | 36.1% | 37.9% |
| Range | 33.0% | 36.9% |
| Mean | 15.9% | 11.9% |
| Median | 14.3% | 11.5% |
| Interquartile 25% (IQ1) | 10.9% | 7.4% |
| Interquartile 75% (IQ3) | 20.4% | 16.0% |
| Interquartile Range (IQR) | 9.6% | 8.5% |
| Standard Deviation (Sample) | 8.0% | 6.6% |
| Standard Deviation (Population) | 7.8% | 6.6% |
Similar Demographics by Master's Degree
Demographics Similar to Immigrants from Zaire by Master's Degree
In terms of master's degree, the demographic groups most similar to Immigrants from Zaire are Sri Lankan (14.7%, a difference of 0.020%), Czech (14.7%, a difference of 0.12%), Barbadian (14.7%, a difference of 0.16%), Swiss (14.7%, a difference of 0.22%), and Immigrants from Iraq (14.8%, a difference of 0.25%).
| Demographics | Rating | Rank | Master's Degree |
| Immigrants | Colombia | 48.3 /100 | #177 | Average 14.9% |
| English | 45.0 /100 | #178 | Average 14.8% |
| Immigrants | Iraq | 41.3 /100 | #179 | Average 14.8% |
| Celtics | 41.3 /100 | #180 | Average 14.8% |
| Swiss | 41.1 /100 | #181 | Average 14.7% |
| Czechs | 40.4 /100 | #182 | Average 14.7% |
| Sri Lankans | 39.6 /100 | #183 | Fair 14.7% |
| Immigrants | Zaire | 39.5 /100 | #184 | Fair 14.7% |
| Barbadians | 38.3 /100 | #185 | Fair 14.7% |
| Immigrants | Oceania | 37.1 /100 | #186 | Fair 14.7% |
| Basques | 36.5 /100 | #187 | Fair 14.7% |
| Immigrants | Costa Rica | 36.2 /100 | #188 | Fair 14.7% |
| Immigrants | Immigrants | 36.0 /100 | #189 | Fair 14.6% |
| Spaniards | 35.8 /100 | #190 | Fair 14.6% |
| Welsh | 34.2 /100 | #191 | Fair 14.6% |
Demographics Similar to Poles by Master's Degree
In terms of master's degree, the demographic groups most similar to Poles are Vietnamese (15.8%, a difference of 0.12%), Immigrants from Germany (15.8%, a difference of 0.21%), Immigrants from Africa (15.7%, a difference of 0.23%), Pakistani (15.8%, a difference of 0.27%), and Immigrants from Venezuela (15.7%, a difference of 0.32%).
| Demographics | Rating | Rank | Master's Degree |
| Venezuelans | 88.4 /100 | #134 | Excellent 15.9% |
| South American Indians | 88.4 /100 | #135 | Excellent 15.9% |
| Assyrians/Chaldeans/Syriacs | 86.8 /100 | #136 | Excellent 15.8% |
| Europeans | 86.4 /100 | #137 | Excellent 15.8% |
| Pakistanis | 86.1 /100 | #138 | Excellent 15.8% |
| Immigrants | Germany | 85.9 /100 | #139 | Excellent 15.8% |
| Vietnamese | 85.5 /100 | #140 | Excellent 15.8% |
| Poles | 85.0 /100 | #141 | Excellent 15.7% |
| Immigrants | Africa | 84.0 /100 | #142 | Excellent 15.7% |
| Immigrants | Venezuela | 83.6 /100 | #143 | Excellent 15.7% |
| Canadians | 83.3 /100 | #144 | Excellent 15.7% |
| South Americans | 81.3 /100 | #145 | Excellent 15.6% |
| Immigrants | Afghanistan | 79.4 /100 | #146 | Good 15.6% |
| Hungarians | 79.1 /100 | #147 | Good 15.6% |
| Immigrants | Senegal | 78.2 /100 | #148 | Good 15.5% |