Immigrants from Western Asia vs Polish Master's Degree
COMPARE
Immigrants from Western Asia
Polish
Master's Degree
Master's Degree Comparison
Immigrants from Western Asia
Poles
17.5%
MASTER'S DEGREE
99.5/ 100
METRIC RATING
81st/ 347
METRIC RANK
15.7%
MASTER'S DEGREE
85.0/ 100
METRIC RATING
141st/ 347
METRIC RANK
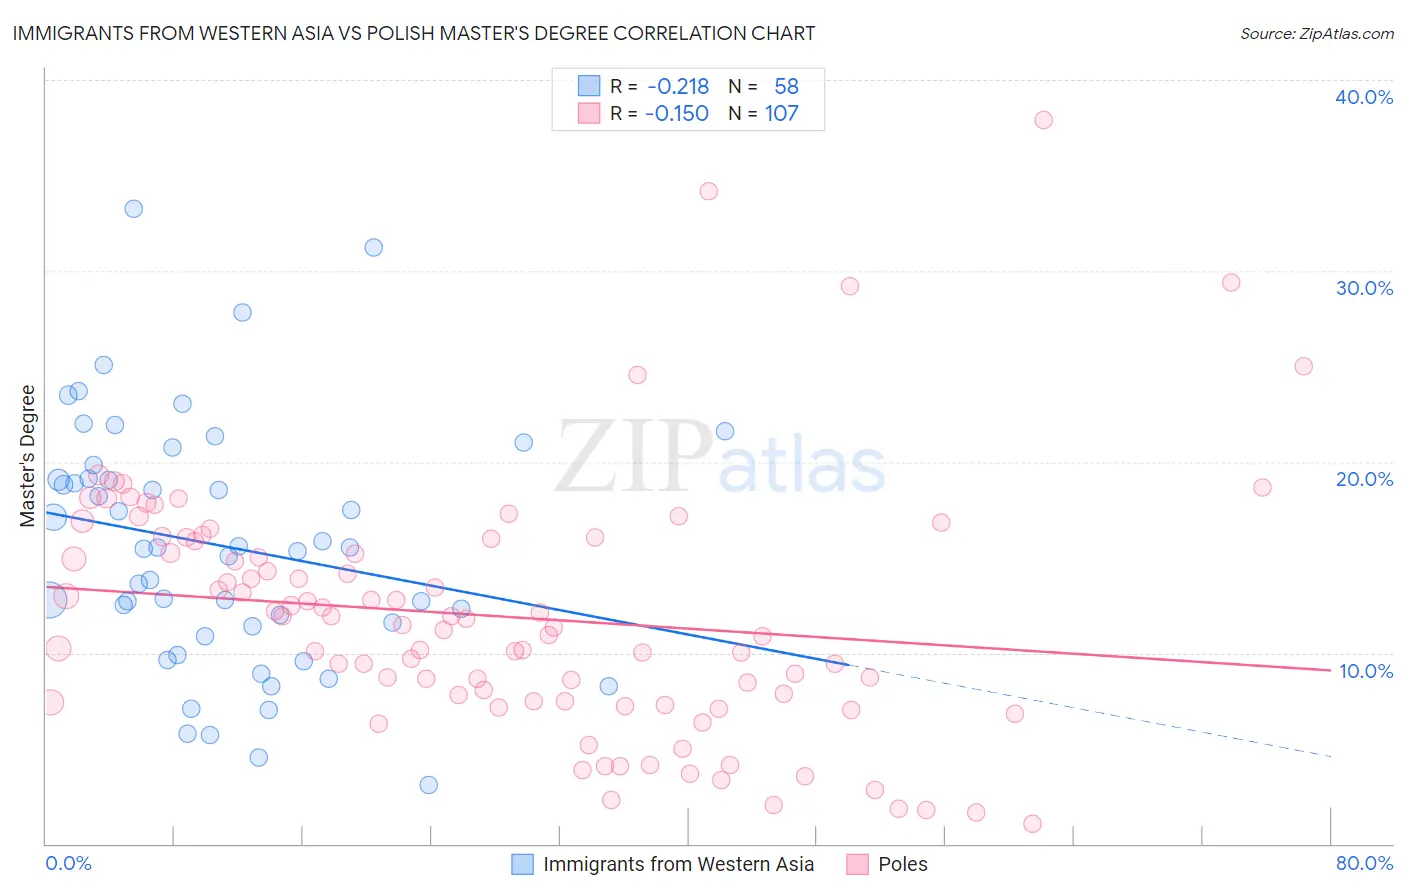
Immigrants from Western Asia vs Polish Master's Degree Correlation Chart
The statistical analysis conducted on geographies consisting of 404,328,411 people shows a weak negative correlation between the proportion of Immigrants from Western Asia and percentage of population with at least master's degree education in the United States with a correlation coefficient (R) of -0.218 and weighted average of 17.5%. Similarly, the statistical analysis conducted on geographies consisting of 559,882,025 people shows a poor negative correlation between the proportion of Poles and percentage of population with at least master's degree education in the United States with a correlation coefficient (R) of -0.150 and weighted average of 15.7%, a difference of 10.9%.
Master's Degree Correlation Summary
| Measurement | Immigrants from Western Asia | Polish |
| Minimum | 3.1% | 1.0% |
| Maximum | 33.2% | 37.9% |
| Range | 30.2% | 36.9% |
| Mean | 15.6% | 11.9% |
| Median | 15.5% | 11.5% |
| Interquartile 25% (IQ1) | 11.4% | 7.4% |
| Interquartile 75% (IQ3) | 19.1% | 16.0% |
| Interquartile Range (IQR) | 7.8% | 8.5% |
| Standard Deviation (Sample) | 6.4% | 6.6% |
| Standard Deviation (Population) | 6.4% | 6.6% |
Similar Demographics by Master's Degree
Demographics Similar to Immigrants from Western Asia by Master's Degree
In terms of master's degree, the demographic groups most similar to Immigrants from Western Asia are Greek (17.5%, a difference of 0.050%), Immigrants from Zimbabwe (17.4%, a difference of 0.11%), Carpatho Rusyn (17.5%, a difference of 0.30%), Immigrants from Lebanon (17.5%, a difference of 0.35%), and Immigrants from Scotland (17.4%, a difference of 0.44%).
| Demographics | Rating | Rank | Master's Degree |
| Immigrants | Romania | 99.7 /100 | #74 | Exceptional 17.7% |
| Egyptians | 99.6 /100 | #75 | Exceptional 17.6% |
| Immigrants | Indonesia | 99.6 /100 | #76 | Exceptional 17.6% |
| Immigrants | Eastern Europe | 99.6 /100 | #77 | Exceptional 17.6% |
| Immigrants | Hungary | 99.6 /100 | #78 | Exceptional 17.5% |
| Immigrants | Lebanon | 99.6 /100 | #79 | Exceptional 17.5% |
| Carpatho Rusyns | 99.6 /100 | #80 | Exceptional 17.5% |
| Immigrants | Western Asia | 99.5 /100 | #81 | Exceptional 17.5% |
| Greeks | 99.5 /100 | #82 | Exceptional 17.5% |
| Immigrants | Zimbabwe | 99.5 /100 | #83 | Exceptional 17.4% |
| Immigrants | Scotland | 99.4 /100 | #84 | Exceptional 17.4% |
| Immigrants | Brazil | 99.4 /100 | #85 | Exceptional 17.4% |
| Immigrants | Croatia | 99.3 /100 | #86 | Exceptional 17.3% |
| Maltese | 99.3 /100 | #87 | Exceptional 17.3% |
| Immigrants | Canada | 99.2 /100 | #88 | Exceptional 17.2% |
Demographics Similar to Poles by Master's Degree
In terms of master's degree, the demographic groups most similar to Poles are Vietnamese (15.8%, a difference of 0.12%), Immigrants from Germany (15.8%, a difference of 0.21%), Immigrants from Africa (15.7%, a difference of 0.23%), Pakistani (15.8%, a difference of 0.27%), and Immigrants from Venezuela (15.7%, a difference of 0.32%).
| Demographics | Rating | Rank | Master's Degree |
| Venezuelans | 88.4 /100 | #134 | Excellent 15.9% |
| South American Indians | 88.4 /100 | #135 | Excellent 15.9% |
| Assyrians/Chaldeans/Syriacs | 86.8 /100 | #136 | Excellent 15.8% |
| Europeans | 86.4 /100 | #137 | Excellent 15.8% |
| Pakistanis | 86.1 /100 | #138 | Excellent 15.8% |
| Immigrants | Germany | 85.9 /100 | #139 | Excellent 15.8% |
| Vietnamese | 85.5 /100 | #140 | Excellent 15.8% |
| Poles | 85.0 /100 | #141 | Excellent 15.7% |
| Immigrants | Africa | 84.0 /100 | #142 | Excellent 15.7% |
| Immigrants | Venezuela | 83.6 /100 | #143 | Excellent 15.7% |
| Canadians | 83.3 /100 | #144 | Excellent 15.7% |
| South Americans | 81.3 /100 | #145 | Excellent 15.6% |
| Immigrants | Afghanistan | 79.4 /100 | #146 | Good 15.6% |
| Hungarians | 79.1 /100 | #147 | Good 15.6% |
| Immigrants | Senegal | 78.2 /100 | #148 | Good 15.5% |