Menominee vs Polish Associate's Degree
COMPARE
Menominee
Polish
Associate's Degree
Associate's Degree Comparison
Menominee
Poles
36.7%
ASSOCIATE'S DEGREE
0.0/ 100
METRIC RATING
325th/ 347
METRIC RANK
48.0%
ASSOCIATE'S DEGREE
87.3/ 100
METRIC RATING
138th/ 347
METRIC RANK
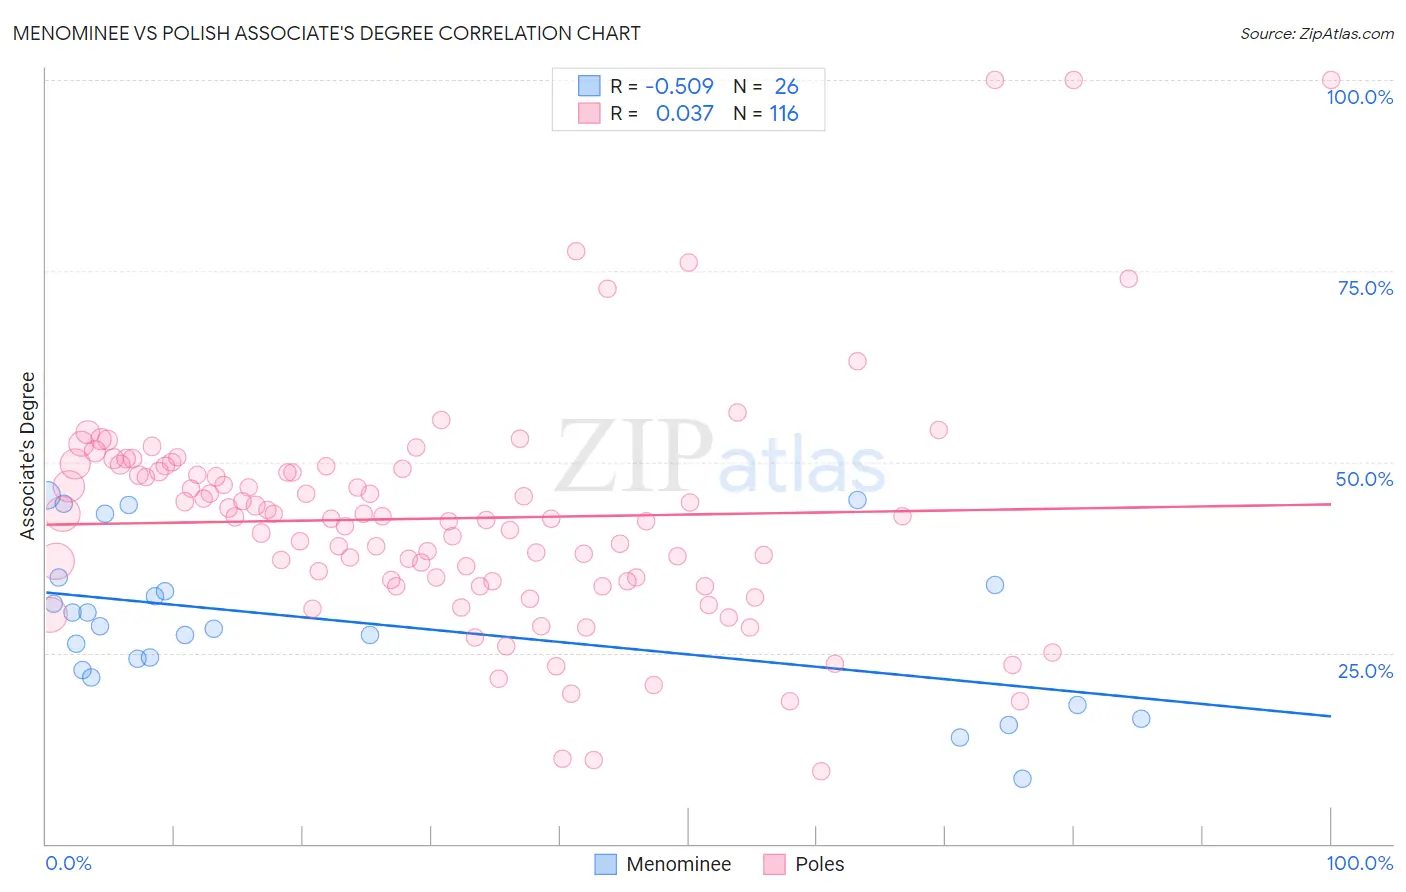
Menominee vs Polish Associate's Degree Correlation Chart
The statistical analysis conducted on geographies consisting of 45,778,979 people shows a substantial negative correlation between the proportion of Menominee and percentage of population with at least associate's degree education in the United States with a correlation coefficient (R) of -0.509 and weighted average of 36.7%. Similarly, the statistical analysis conducted on geographies consisting of 560,512,147 people shows no correlation between the proportion of Poles and percentage of population with at least associate's degree education in the United States with a correlation coefficient (R) of 0.037 and weighted average of 48.0%, a difference of 30.9%.
Associate's Degree Correlation Summary
| Measurement | Menominee | Polish |
| Minimum | 8.5% | 9.5% |
| Maximum | 45.6% | 100.0% |
| Range | 37.1% | 90.5% |
| Mean | 28.9% | 42.6% |
| Median | 28.3% | 42.7% |
| Interquartile 25% (IQ1) | 22.8% | 34.4% |
| Interquartile 75% (IQ3) | 33.8% | 48.9% |
| Interquartile Range (IQR) | 11.0% | 14.5% |
| Standard Deviation (Sample) | 10.1% | 15.3% |
| Standard Deviation (Population) | 9.9% | 15.2% |
Similar Demographics by Associate's Degree
Demographics Similar to Menominee by Associate's Degree
In terms of associate's degree, the demographic groups most similar to Menominee are Arapaho (36.7%, a difference of 0.11%), Immigrants from Cabo Verde (36.8%, a difference of 0.27%), Kiowa (36.5%, a difference of 0.56%), Dutch West Indian (36.5%, a difference of 0.58%), and Alaskan Athabascan (36.5%, a difference of 0.59%).
| Demographics | Rating | Rank | Associate's Degree |
| Alaska Natives | 0.0 /100 | #318 | Tragic 37.5% |
| Fijians | 0.0 /100 | #319 | Tragic 37.4% |
| Cajuns | 0.0 /100 | #320 | Tragic 37.4% |
| Immigrants | Yemen | 0.0 /100 | #321 | Tragic 37.3% |
| Pennsylvania Germans | 0.0 /100 | #322 | Tragic 37.2% |
| Immigrants | Cabo Verde | 0.0 /100 | #323 | Tragic 36.8% |
| Arapaho | 0.0 /100 | #324 | Tragic 36.7% |
| Menominee | 0.0 /100 | #325 | Tragic 36.7% |
| Kiowa | 0.0 /100 | #326 | Tragic 36.5% |
| Dutch West Indians | 0.0 /100 | #327 | Tragic 36.5% |
| Alaskan Athabascans | 0.0 /100 | #328 | Tragic 36.5% |
| Paiute | 0.0 /100 | #329 | Tragic 36.4% |
| Apache | 0.0 /100 | #330 | Tragic 36.2% |
| Immigrants | Azores | 0.0 /100 | #331 | Tragic 35.6% |
| Immigrants | Central America | 0.0 /100 | #332 | Tragic 35.0% |
Demographics Similar to Poles by Associate's Degree
In terms of associate's degree, the demographic groups most similar to Poles are Immigrants from Eritrea (48.1%, a difference of 0.070%), Pakistani (48.1%, a difference of 0.11%), European (48.2%, a difference of 0.29%), Moroccan (48.2%, a difference of 0.35%), and Slovene (47.9%, a difference of 0.35%).
| Demographics | Rating | Rank | Associate's Degree |
| Icelanders | 90.8 /100 | #131 | Exceptional 48.3% |
| Immigrants | Albania | 89.9 /100 | #132 | Excellent 48.2% |
| Assyrians/Chaldeans/Syriacs | 89.4 /100 | #133 | Excellent 48.2% |
| Moroccans | 89.3 /100 | #134 | Excellent 48.2% |
| Europeans | 89.0 /100 | #135 | Excellent 48.2% |
| Pakistanis | 88.0 /100 | #136 | Excellent 48.1% |
| Immigrants | Eritrea | 87.8 /100 | #137 | Excellent 48.1% |
| Poles | 87.3 /100 | #138 | Excellent 48.0% |
| Slovenes | 85.1 /100 | #139 | Excellent 47.9% |
| Immigrants | Southern Europe | 84.4 /100 | #140 | Excellent 47.8% |
| Taiwanese | 83.3 /100 | #141 | Excellent 47.7% |
| Sierra Leoneans | 82.9 /100 | #142 | Excellent 47.7% |
| Norwegians | 81.0 /100 | #143 | Excellent 47.6% |
| Slavs | 80.5 /100 | #144 | Excellent 47.6% |
| Canadians | 79.0 /100 | #145 | Good 47.5% |