Ecuadorian vs Senegalese Bachelor's Degree
COMPARE
Ecuadorian
Senegalese
Bachelor's Degree
Bachelor's Degree Comparison
Ecuadorians
Senegalese
35.4%
BACHELOR'S DEGREE
6.6/ 100
METRIC RATING
227th/ 347
METRIC RANK
37.5%
BACHELOR'S DEGREE
42.2/ 100
METRIC RATING
183rd/ 347
METRIC RANK
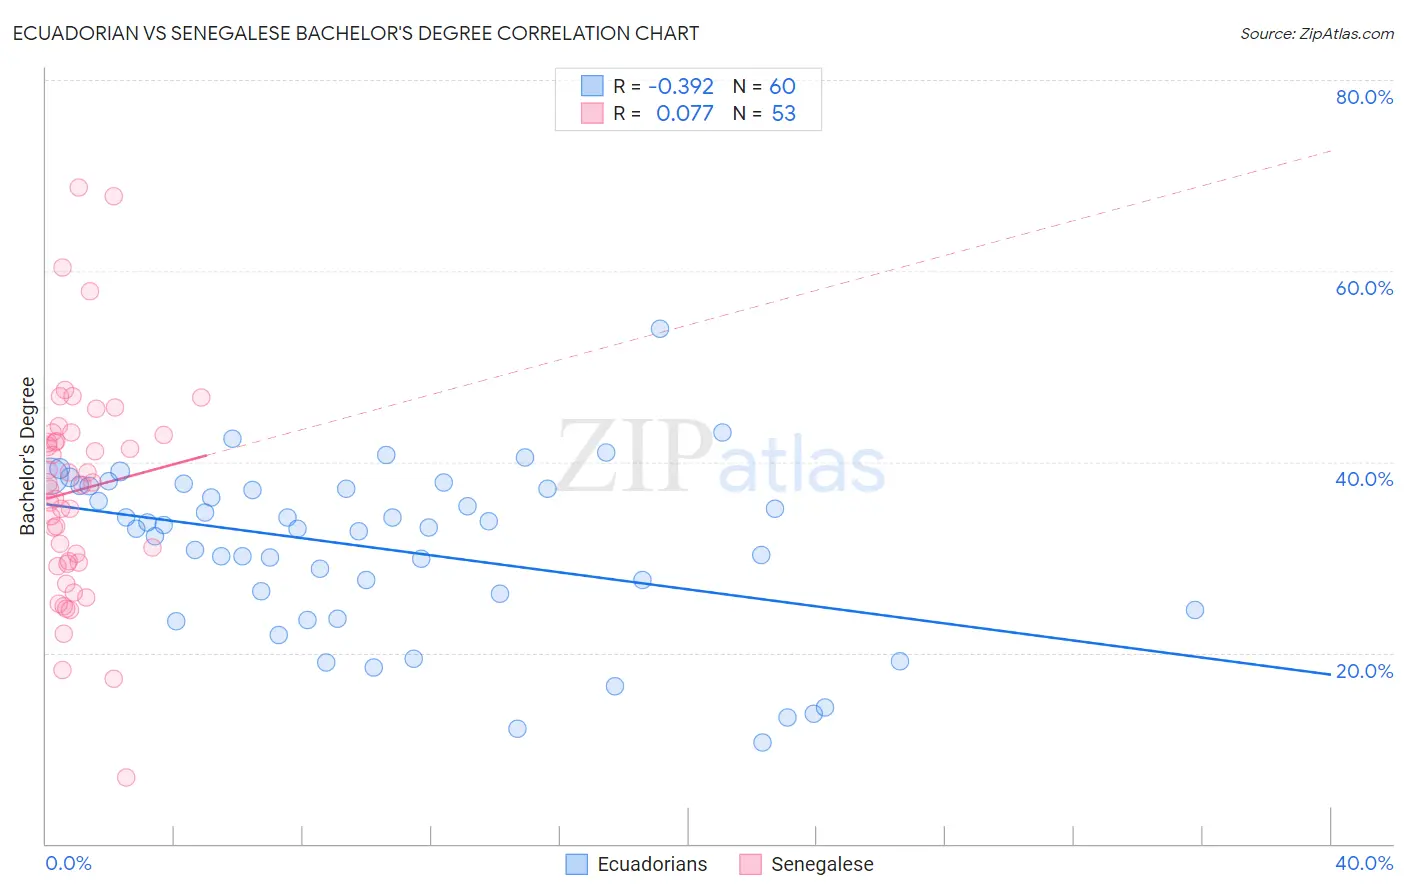
Ecuadorian vs Senegalese Bachelor's Degree Correlation Chart
The statistical analysis conducted on geographies consisting of 317,830,457 people shows a mild negative correlation between the proportion of Ecuadorians and percentage of population with at least bachelor's degree education in the United States with a correlation coefficient (R) of -0.392 and weighted average of 35.4%. Similarly, the statistical analysis conducted on geographies consisting of 78,136,633 people shows a slight positive correlation between the proportion of Senegalese and percentage of population with at least bachelor's degree education in the United States with a correlation coefficient (R) of 0.077 and weighted average of 37.5%, a difference of 6.1%.
Bachelor's Degree Correlation Summary
| Measurement | Ecuadorian | Senegalese |
| Minimum | 10.6% | 6.9% |
| Maximum | 53.9% | 68.8% |
| Range | 43.3% | 61.9% |
| Mean | 30.9% | 37.0% |
| Median | 33.1% | 37.6% |
| Interquartile 25% (IQ1) | 25.3% | 29.4% |
| Interquartile 75% (IQ3) | 37.4% | 42.9% |
| Interquartile Range (IQR) | 12.1% | 13.5% |
| Standard Deviation (Sample) | 8.9% | 11.6% |
| Standard Deviation (Population) | 8.8% | 11.5% |
Similar Demographics by Bachelor's Degree
Demographics Similar to Ecuadorians by Bachelor's Degree
In terms of bachelor's degree, the demographic groups most similar to Ecuadorians are Immigrants from Trinidad and Tobago (35.3%, a difference of 0.23%), Portuguese (35.5%, a difference of 0.26%), Immigrants from Burma/Myanmar (35.5%, a difference of 0.30%), White/Caucasian (35.3%, a difference of 0.31%), and Immigrants from Barbados (35.5%, a difference of 0.37%).
| Demographics | Rating | Rank | Bachelor's Degree |
| Spanish | 9.6 /100 | #220 | Tragic 35.8% |
| Dutch | 9.2 /100 | #221 | Tragic 35.7% |
| Trinidadians and Tobagonians | 8.8 /100 | #222 | Tragic 35.7% |
| French Canadians | 8.3 /100 | #223 | Tragic 35.6% |
| Immigrants | Barbados | 7.5 /100 | #224 | Tragic 35.5% |
| Immigrants | Burma/Myanmar | 7.3 /100 | #225 | Tragic 35.5% |
| Portuguese | 7.2 /100 | #226 | Tragic 35.5% |
| Ecuadorians | 6.6 /100 | #227 | Tragic 35.4% |
| Immigrants | Trinidad and Tobago | 6.0 /100 | #228 | Tragic 35.3% |
| Whites/Caucasians | 5.9 /100 | #229 | Tragic 35.3% |
| Immigrants | Grenada | 4.3 /100 | #230 | Tragic 35.0% |
| Immigrants | St. Vincent and the Grenadines | 4.3 /100 | #231 | Tragic 35.0% |
| Hmong | 3.4 /100 | #232 | Tragic 34.8% |
| Immigrants | Ecuador | 3.3 /100 | #233 | Tragic 34.7% |
| Guamanians/Chamorros | 3.0 /100 | #234 | Tragic 34.6% |
Demographics Similar to Senegalese by Bachelor's Degree
In terms of bachelor's degree, the demographic groups most similar to Senegalese are Scandinavian (37.5%, a difference of 0.040%), Immigrants from Peru (37.5%, a difference of 0.080%), Immigrants from Bosnia and Herzegovina (37.6%, a difference of 0.13%), Immigrants from Senegal (37.6%, a difference of 0.16%), and Norwegian (37.5%, a difference of 0.18%).
| Demographics | Rating | Rank | Bachelor's Degree |
| Costa Ricans | 47.6 /100 | #176 | Average 37.7% |
| Basques | 47.4 /100 | #177 | Average 37.7% |
| Immigrants | Cameroon | 46.8 /100 | #178 | Average 37.7% |
| Immigrants | Colombia | 45.4 /100 | #179 | Average 37.7% |
| Irish | 44.3 /100 | #180 | Average 37.6% |
| Immigrants | Senegal | 43.8 /100 | #181 | Average 37.6% |
| Immigrants | Bosnia and Herzegovina | 43.4 /100 | #182 | Average 37.6% |
| Senegalese | 42.2 /100 | #183 | Average 37.5% |
| Scandinavians | 41.7 /100 | #184 | Average 37.5% |
| Immigrants | Peru | 41.3 /100 | #185 | Average 37.5% |
| Norwegians | 40.4 /100 | #186 | Average 37.5% |
| English | 39.7 /100 | #187 | Fair 37.4% |
| Immigrants | Oceania | 37.3 /100 | #188 | Fair 37.3% |
| Slovaks | 36.9 /100 | #189 | Fair 37.3% |
| Swiss | 34.1 /100 | #190 | Fair 37.2% |