Central American Indian vs Senegalese Bachelor's Degree
COMPARE
Central American Indian
Senegalese
Bachelor's Degree
Bachelor's Degree Comparison
Central American Indians
Senegalese
32.5%
BACHELOR'S DEGREE
0.3/ 100
METRIC RATING
264th/ 347
METRIC RANK
37.5%
BACHELOR'S DEGREE
42.2/ 100
METRIC RATING
183rd/ 347
METRIC RANK
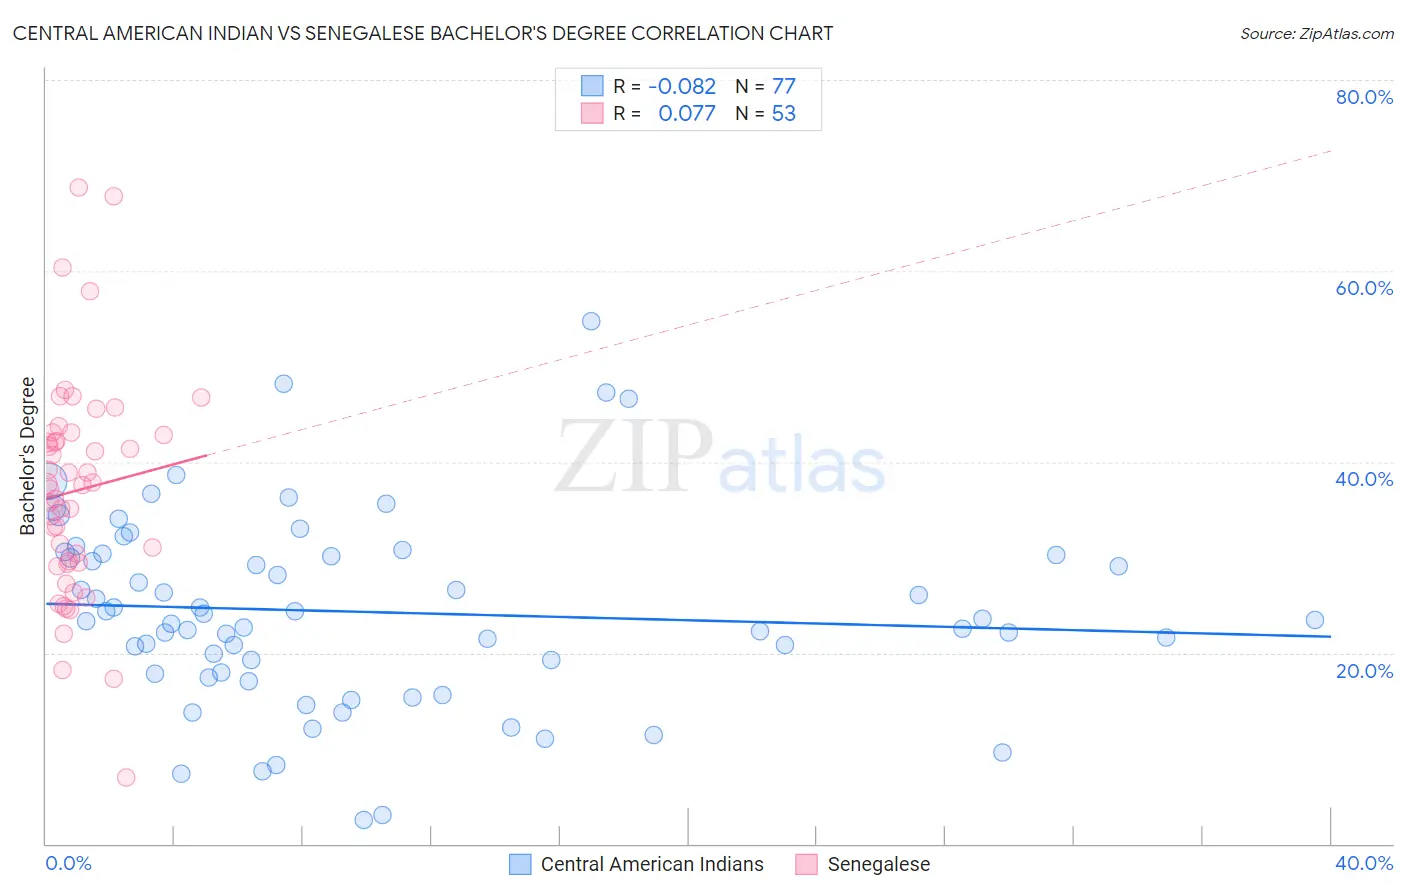
Central American Indian vs Senegalese Bachelor's Degree Correlation Chart
The statistical analysis conducted on geographies consisting of 326,135,585 people shows a slight negative correlation between the proportion of Central American Indians and percentage of population with at least bachelor's degree education in the United States with a correlation coefficient (R) of -0.082 and weighted average of 32.5%. Similarly, the statistical analysis conducted on geographies consisting of 78,136,633 people shows a slight positive correlation between the proportion of Senegalese and percentage of population with at least bachelor's degree education in the United States with a correlation coefficient (R) of 0.077 and weighted average of 37.5%, a difference of 15.3%.
Bachelor's Degree Correlation Summary
| Measurement | Central American Indian | Senegalese |
| Minimum | 2.5% | 6.9% |
| Maximum | 54.7% | 68.8% |
| Range | 52.2% | 61.9% |
| Mean | 24.3% | 37.0% |
| Median | 23.4% | 37.6% |
| Interquartile 25% (IQ1) | 17.8% | 29.4% |
| Interquartile 75% (IQ3) | 30.3% | 42.9% |
| Interquartile Range (IQR) | 12.5% | 13.5% |
| Standard Deviation (Sample) | 10.1% | 11.6% |
| Standard Deviation (Population) | 10.0% | 11.5% |
Similar Demographics by Bachelor's Degree
Demographics Similar to Central American Indians by Bachelor's Degree
In terms of bachelor's degree, the demographic groups most similar to Central American Indians are Bahamian (32.5%, a difference of 0.030%), Immigrants from Dominica (32.5%, a difference of 0.060%), Cuban (32.5%, a difference of 0.18%), Belizean (32.8%, a difference of 0.78%), and Immigrants from Portugal (32.2%, a difference of 0.94%).
| Demographics | Rating | Rank | Bachelor's Degree |
| Spanish Americans | 0.6 /100 | #257 | Tragic 33.1% |
| French American Indians | 0.6 /100 | #258 | Tragic 33.1% |
| Osage | 0.5 /100 | #259 | Tragic 33.0% |
| Malaysians | 0.5 /100 | #260 | Tragic 32.9% |
| Africans | 0.5 /100 | #261 | Tragic 32.9% |
| Immigrants | Jamaica | 0.5 /100 | #262 | Tragic 32.9% |
| Belizeans | 0.4 /100 | #263 | Tragic 32.8% |
| Central American Indians | 0.3 /100 | #264 | Tragic 32.5% |
| Bahamians | 0.3 /100 | #265 | Tragic 32.5% |
| Immigrants | Dominica | 0.3 /100 | #266 | Tragic 32.5% |
| Cubans | 0.3 /100 | #267 | Tragic 32.5% |
| Immigrants | Portugal | 0.2 /100 | #268 | Tragic 32.2% |
| Immigrants | Belize | 0.2 /100 | #269 | Tragic 32.1% |
| Immigrants | Nicaragua | 0.2 /100 | #270 | Tragic 31.9% |
| Central Americans | 0.2 /100 | #271 | Tragic 31.9% |
Demographics Similar to Senegalese by Bachelor's Degree
In terms of bachelor's degree, the demographic groups most similar to Senegalese are Scandinavian (37.5%, a difference of 0.040%), Immigrants from Peru (37.5%, a difference of 0.080%), Immigrants from Bosnia and Herzegovina (37.6%, a difference of 0.13%), Immigrants from Senegal (37.6%, a difference of 0.16%), and Norwegian (37.5%, a difference of 0.18%).
| Demographics | Rating | Rank | Bachelor's Degree |
| Costa Ricans | 47.6 /100 | #176 | Average 37.7% |
| Basques | 47.4 /100 | #177 | Average 37.7% |
| Immigrants | Cameroon | 46.8 /100 | #178 | Average 37.7% |
| Immigrants | Colombia | 45.4 /100 | #179 | Average 37.7% |
| Irish | 44.3 /100 | #180 | Average 37.6% |
| Immigrants | Senegal | 43.8 /100 | #181 | Average 37.6% |
| Immigrants | Bosnia and Herzegovina | 43.4 /100 | #182 | Average 37.6% |
| Senegalese | 42.2 /100 | #183 | Average 37.5% |
| Scandinavians | 41.7 /100 | #184 | Average 37.5% |
| Immigrants | Peru | 41.3 /100 | #185 | Average 37.5% |
| Norwegians | 40.4 /100 | #186 | Average 37.5% |
| English | 39.7 /100 | #187 | Fair 37.4% |
| Immigrants | Oceania | 37.3 /100 | #188 | Fair 37.3% |
| Slovaks | 36.9 /100 | #189 | Fair 37.3% |
| Swiss | 34.1 /100 | #190 | Fair 37.2% |