Ecuadorian vs Pennsylvania German Bachelor's Degree
COMPARE
Ecuadorian
Pennsylvania German
Bachelor's Degree
Bachelor's Degree Comparison
Ecuadorians
Pennsylvania Germans
35.4%
BACHELOR'S DEGREE
6.6/ 100
METRIC RATING
227th/ 347
METRIC RANK
28.4%
BACHELOR'S DEGREE
0.0/ 100
METRIC RATING
325th/ 347
METRIC RANK
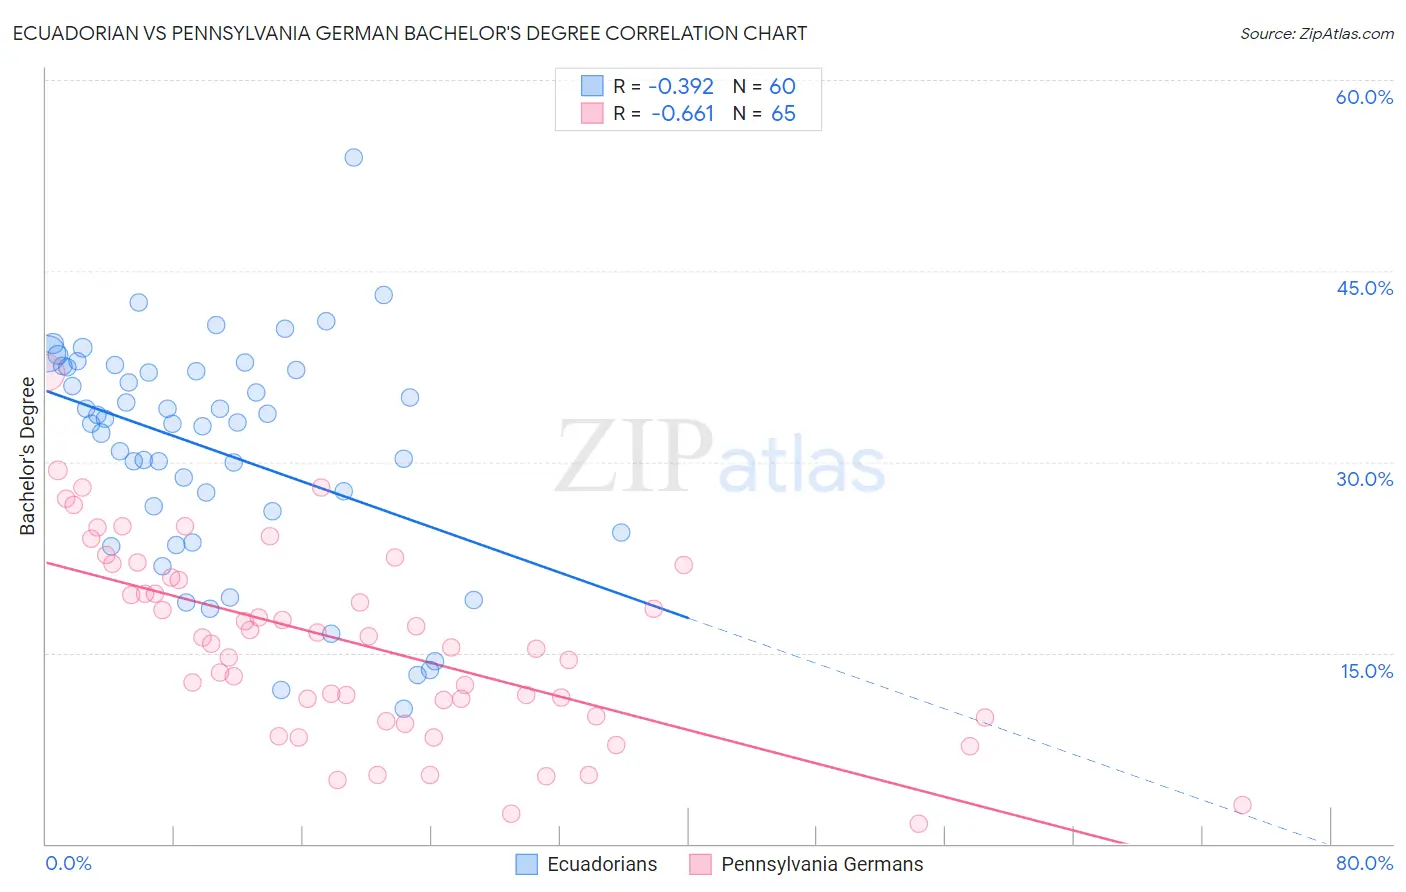
Ecuadorian vs Pennsylvania German Bachelor's Degree Correlation Chart
The statistical analysis conducted on geographies consisting of 317,830,457 people shows a mild negative correlation between the proportion of Ecuadorians and percentage of population with at least bachelor's degree education in the United States with a correlation coefficient (R) of -0.392 and weighted average of 35.4%. Similarly, the statistical analysis conducted on geographies consisting of 234,090,370 people shows a significant negative correlation between the proportion of Pennsylvania Germans and percentage of population with at least bachelor's degree education in the United States with a correlation coefficient (R) of -0.661 and weighted average of 28.4%, a difference of 24.6%.
Bachelor's Degree Correlation Summary
| Measurement | Ecuadorian | Pennsylvania German |
| Minimum | 10.6% | 1.6% |
| Maximum | 53.9% | 37.0% |
| Range | 43.3% | 35.5% |
| Mean | 30.9% | 15.7% |
| Median | 33.1% | 15.7% |
| Interquartile 25% (IQ1) | 25.3% | 10.0% |
| Interquartile 75% (IQ3) | 37.4% | 21.4% |
| Interquartile Range (IQR) | 12.1% | 11.4% |
| Standard Deviation (Sample) | 8.9% | 7.5% |
| Standard Deviation (Population) | 8.8% | 7.4% |
Similar Demographics by Bachelor's Degree
Demographics Similar to Ecuadorians by Bachelor's Degree
In terms of bachelor's degree, the demographic groups most similar to Ecuadorians are Immigrants from Trinidad and Tobago (35.3%, a difference of 0.23%), Portuguese (35.5%, a difference of 0.26%), Immigrants from Burma/Myanmar (35.5%, a difference of 0.30%), White/Caucasian (35.3%, a difference of 0.31%), and Immigrants from Barbados (35.5%, a difference of 0.37%).
| Demographics | Rating | Rank | Bachelor's Degree |
| Spanish | 9.6 /100 | #220 | Tragic 35.8% |
| Dutch | 9.2 /100 | #221 | Tragic 35.7% |
| Trinidadians and Tobagonians | 8.8 /100 | #222 | Tragic 35.7% |
| French Canadians | 8.3 /100 | #223 | Tragic 35.6% |
| Immigrants | Barbados | 7.5 /100 | #224 | Tragic 35.5% |
| Immigrants | Burma/Myanmar | 7.3 /100 | #225 | Tragic 35.5% |
| Portuguese | 7.2 /100 | #226 | Tragic 35.5% |
| Ecuadorians | 6.6 /100 | #227 | Tragic 35.4% |
| Immigrants | Trinidad and Tobago | 6.0 /100 | #228 | Tragic 35.3% |
| Whites/Caucasians | 5.9 /100 | #229 | Tragic 35.3% |
| Immigrants | Grenada | 4.3 /100 | #230 | Tragic 35.0% |
| Immigrants | St. Vincent and the Grenadines | 4.3 /100 | #231 | Tragic 35.0% |
| Hmong | 3.4 /100 | #232 | Tragic 34.8% |
| Immigrants | Ecuador | 3.3 /100 | #233 | Tragic 34.7% |
| Guamanians/Chamorros | 3.0 /100 | #234 | Tragic 34.6% |
Demographics Similar to Pennsylvania Germans by Bachelor's Degree
In terms of bachelor's degree, the demographic groups most similar to Pennsylvania Germans are Apache (28.3%, a difference of 0.39%), Dutch West Indian (28.5%, a difference of 0.45%), Paiute (28.1%, a difference of 1.1%), Fijian (28.7%, a difference of 1.2%), and Tsimshian (28.8%, a difference of 1.3%).
| Demographics | Rating | Rank | Bachelor's Degree |
| Yaqui | 0.0 /100 | #318 | Tragic 29.0% |
| Creek | 0.0 /100 | #319 | Tragic 28.9% |
| Kiowa | 0.0 /100 | #320 | Tragic 28.8% |
| Alaskan Athabascans | 0.0 /100 | #321 | Tragic 28.8% |
| Tsimshian | 0.0 /100 | #322 | Tragic 28.8% |
| Fijians | 0.0 /100 | #323 | Tragic 28.7% |
| Dutch West Indians | 0.0 /100 | #324 | Tragic 28.5% |
| Pennsylvania Germans | 0.0 /100 | #325 | Tragic 28.4% |
| Apache | 0.0 /100 | #326 | Tragic 28.3% |
| Paiute | 0.0 /100 | #327 | Tragic 28.1% |
| Crow | 0.0 /100 | #328 | Tragic 27.7% |
| Immigrants | Central America | 0.0 /100 | #329 | Tragic 27.5% |
| Spanish American Indians | 0.0 /100 | #330 | Tragic 27.5% |
| Immigrants | Azores | 0.0 /100 | #331 | Tragic 27.3% |
| Menominee | 0.0 /100 | #332 | Tragic 27.3% |