Ecuadorian vs American Bachelor's Degree
COMPARE
Ecuadorian
American
Bachelor's Degree
Bachelor's Degree Comparison
Ecuadorians
Americans
35.4%
BACHELOR'S DEGREE
6.6/ 100
METRIC RATING
227th/ 347
METRIC RANK
31.9%
BACHELOR'S DEGREE
0.2/ 100
METRIC RATING
273rd/ 347
METRIC RANK
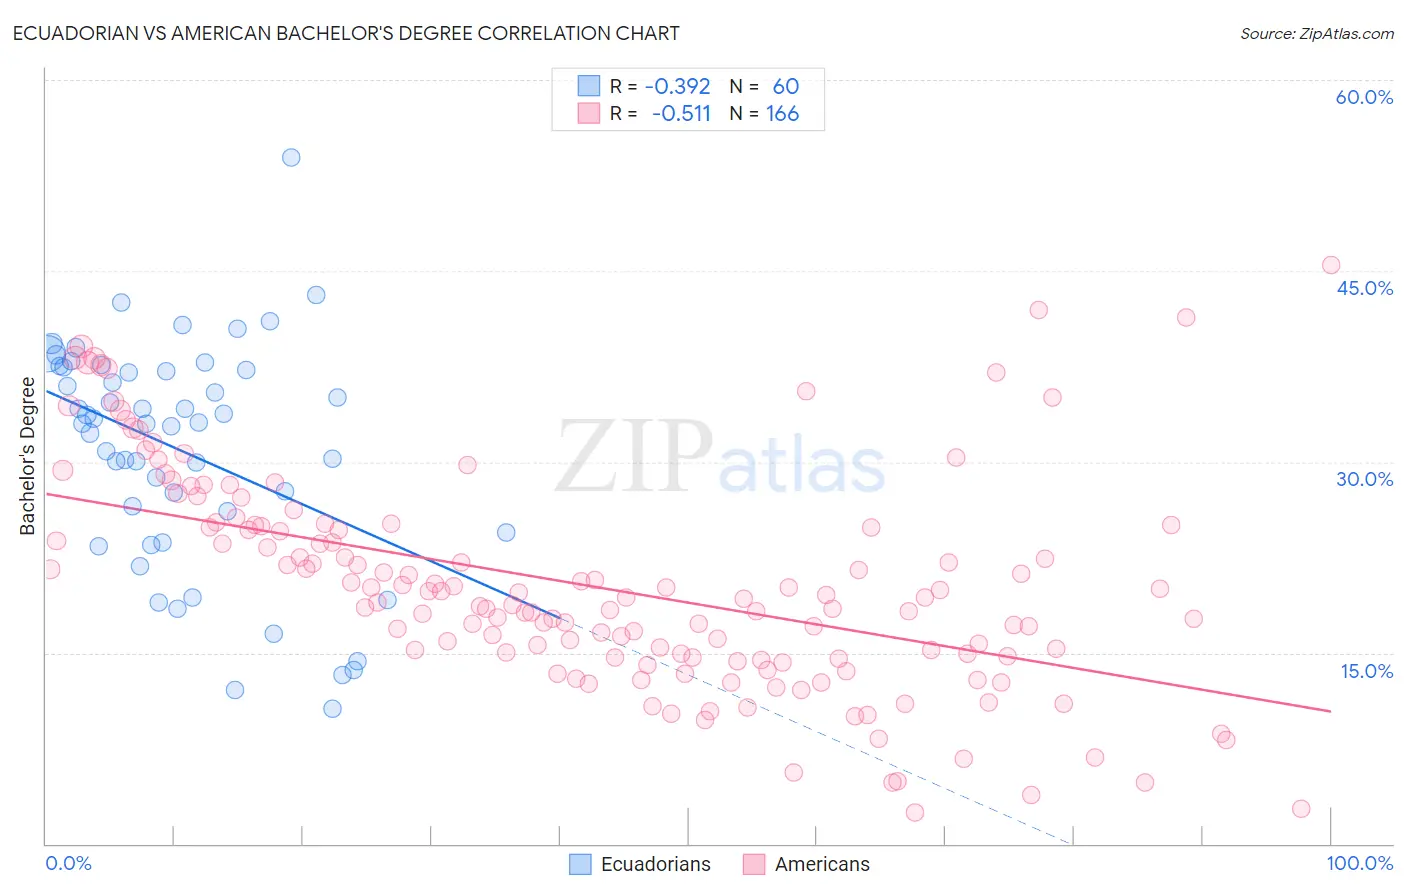
Ecuadorian vs American Bachelor's Degree Correlation Chart
The statistical analysis conducted on geographies consisting of 317,830,457 people shows a mild negative correlation between the proportion of Ecuadorians and percentage of population with at least bachelor's degree education in the United States with a correlation coefficient (R) of -0.392 and weighted average of 35.4%. Similarly, the statistical analysis conducted on geographies consisting of 581,681,572 people shows a substantial negative correlation between the proportion of Americans and percentage of population with at least bachelor's degree education in the United States with a correlation coefficient (R) of -0.511 and weighted average of 31.9%, a difference of 11.1%.
Bachelor's Degree Correlation Summary
| Measurement | Ecuadorian | American |
| Minimum | 10.6% | 2.5% |
| Maximum | 53.9% | 45.5% |
| Range | 43.3% | 43.0% |
| Mean | 30.9% | 20.2% |
| Median | 33.1% | 19.3% |
| Interquartile 25% (IQ1) | 25.3% | 14.6% |
| Interquartile 75% (IQ3) | 37.4% | 24.9% |
| Interquartile Range (IQR) | 12.1% | 10.3% |
| Standard Deviation (Sample) | 8.9% | 8.5% |
| Standard Deviation (Population) | 8.8% | 8.5% |
Similar Demographics by Bachelor's Degree
Demographics Similar to Ecuadorians by Bachelor's Degree
In terms of bachelor's degree, the demographic groups most similar to Ecuadorians are Immigrants from Trinidad and Tobago (35.3%, a difference of 0.23%), Portuguese (35.5%, a difference of 0.26%), Immigrants from Burma/Myanmar (35.5%, a difference of 0.30%), White/Caucasian (35.3%, a difference of 0.31%), and Immigrants from Barbados (35.5%, a difference of 0.37%).
| Demographics | Rating | Rank | Bachelor's Degree |
| Spanish | 9.6 /100 | #220 | Tragic 35.8% |
| Dutch | 9.2 /100 | #221 | Tragic 35.7% |
| Trinidadians and Tobagonians | 8.8 /100 | #222 | Tragic 35.7% |
| French Canadians | 8.3 /100 | #223 | Tragic 35.6% |
| Immigrants | Barbados | 7.5 /100 | #224 | Tragic 35.5% |
| Immigrants | Burma/Myanmar | 7.3 /100 | #225 | Tragic 35.5% |
| Portuguese | 7.2 /100 | #226 | Tragic 35.5% |
| Ecuadorians | 6.6 /100 | #227 | Tragic 35.4% |
| Immigrants | Trinidad and Tobago | 6.0 /100 | #228 | Tragic 35.3% |
| Whites/Caucasians | 5.9 /100 | #229 | Tragic 35.3% |
| Immigrants | Grenada | 4.3 /100 | #230 | Tragic 35.0% |
| Immigrants | St. Vincent and the Grenadines | 4.3 /100 | #231 | Tragic 35.0% |
| Hmong | 3.4 /100 | #232 | Tragic 34.8% |
| Immigrants | Ecuador | 3.3 /100 | #233 | Tragic 34.7% |
| Guamanians/Chamorros | 3.0 /100 | #234 | Tragic 34.6% |
Demographics Similar to Americans by Bachelor's Degree
In terms of bachelor's degree, the demographic groups most similar to Americans are Potawatomi (31.9%, a difference of 0.020%), Comanche (31.9%, a difference of 0.12%), Central American (31.9%, a difference of 0.15%), Samoan (31.8%, a difference of 0.15%), and Salvadoran (31.8%, a difference of 0.19%).
| Demographics | Rating | Rank | Bachelor's Degree |
| Immigrants | Dominica | 0.3 /100 | #266 | Tragic 32.5% |
| Cubans | 0.3 /100 | #267 | Tragic 32.5% |
| Immigrants | Portugal | 0.2 /100 | #268 | Tragic 32.2% |
| Immigrants | Belize | 0.2 /100 | #269 | Tragic 32.1% |
| Immigrants | Nicaragua | 0.2 /100 | #270 | Tragic 31.9% |
| Central Americans | 0.2 /100 | #271 | Tragic 31.9% |
| Comanche | 0.2 /100 | #272 | Tragic 31.9% |
| Americans | 0.2 /100 | #273 | Tragic 31.9% |
| Potawatomi | 0.2 /100 | #274 | Tragic 31.9% |
| Samoans | 0.1 /100 | #275 | Tragic 31.8% |
| Salvadorans | 0.1 /100 | #276 | Tragic 31.8% |
| Dominicans | 0.1 /100 | #277 | Tragic 31.8% |
| Marshallese | 0.1 /100 | #278 | Tragic 31.7% |
| Hawaiians | 0.1 /100 | #279 | Tragic 31.6% |
| Immigrants | Laos | 0.1 /100 | #280 | Tragic 31.6% |