Ecuadorian vs Houma Bachelor's Degree
COMPARE
Ecuadorian
Houma
Bachelor's Degree
Bachelor's Degree Comparison
Ecuadorians
Houma
35.4%
BACHELOR'S DEGREE
6.6/ 100
METRIC RATING
227th/ 347
METRIC RANK
21.4%
BACHELOR'S DEGREE
0.0/ 100
METRIC RATING
346th/ 347
METRIC RANK
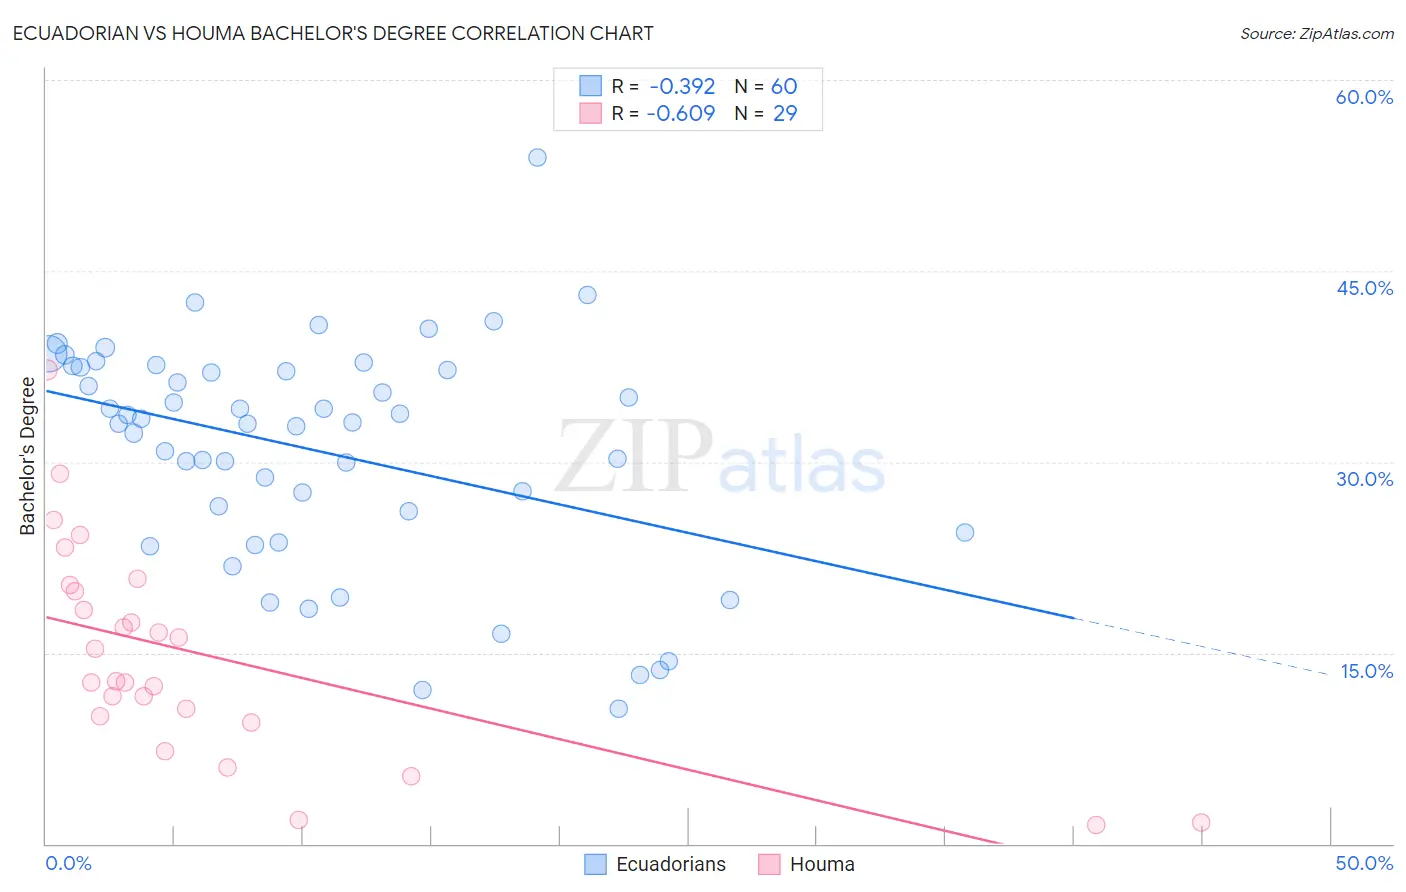
Ecuadorian vs Houma Bachelor's Degree Correlation Chart
The statistical analysis conducted on geographies consisting of 317,830,457 people shows a mild negative correlation between the proportion of Ecuadorians and percentage of population with at least bachelor's degree education in the United States with a correlation coefficient (R) of -0.392 and weighted average of 35.4%. Similarly, the statistical analysis conducted on geographies consisting of 36,792,534 people shows a significant negative correlation between the proportion of Houma and percentage of population with at least bachelor's degree education in the United States with a correlation coefficient (R) of -0.609 and weighted average of 21.4%, a difference of 65.1%.
Bachelor's Degree Correlation Summary
| Measurement | Ecuadorian | Houma |
| Minimum | 10.6% | 1.5% |
| Maximum | 53.9% | 37.2% |
| Range | 43.3% | 35.8% |
| Mean | 30.9% | 14.8% |
| Median | 33.1% | 12.8% |
| Interquartile 25% (IQ1) | 25.3% | 9.8% |
| Interquartile 75% (IQ3) | 37.4% | 20.1% |
| Interquartile Range (IQR) | 12.1% | 10.3% |
| Standard Deviation (Sample) | 8.9% | 8.4% |
| Standard Deviation (Population) | 8.8% | 8.2% |
Similar Demographics by Bachelor's Degree
Demographics Similar to Ecuadorians by Bachelor's Degree
In terms of bachelor's degree, the demographic groups most similar to Ecuadorians are Immigrants from Trinidad and Tobago (35.3%, a difference of 0.23%), Portuguese (35.5%, a difference of 0.26%), Immigrants from Burma/Myanmar (35.5%, a difference of 0.30%), White/Caucasian (35.3%, a difference of 0.31%), and Immigrants from Barbados (35.5%, a difference of 0.37%).
| Demographics | Rating | Rank | Bachelor's Degree |
| Spanish | 9.6 /100 | #220 | Tragic 35.8% |
| Dutch | 9.2 /100 | #221 | Tragic 35.7% |
| Trinidadians and Tobagonians | 8.8 /100 | #222 | Tragic 35.7% |
| French Canadians | 8.3 /100 | #223 | Tragic 35.6% |
| Immigrants | Barbados | 7.5 /100 | #224 | Tragic 35.5% |
| Immigrants | Burma/Myanmar | 7.3 /100 | #225 | Tragic 35.5% |
| Portuguese | 7.2 /100 | #226 | Tragic 35.5% |
| Ecuadorians | 6.6 /100 | #227 | Tragic 35.4% |
| Immigrants | Trinidad and Tobago | 6.0 /100 | #228 | Tragic 35.3% |
| Whites/Caucasians | 5.9 /100 | #229 | Tragic 35.3% |
| Immigrants | Grenada | 4.3 /100 | #230 | Tragic 35.0% |
| Immigrants | St. Vincent and the Grenadines | 4.3 /100 | #231 | Tragic 35.0% |
| Hmong | 3.4 /100 | #232 | Tragic 34.8% |
| Immigrants | Ecuador | 3.3 /100 | #233 | Tragic 34.7% |
| Guamanians/Chamorros | 3.0 /100 | #234 | Tragic 34.6% |
Demographics Similar to Houma by Bachelor's Degree
In terms of bachelor's degree, the demographic groups most similar to Houma are Pima (23.2%, a difference of 8.3%), Navajo (23.6%, a difference of 10.2%), Yup'ik (19.4%, a difference of 10.4%), Tohono O'odham (24.4%, a difference of 14.0%), and Yakama (24.5%, a difference of 14.2%).
| Demographics | Rating | Rank | Bachelor's Degree |
| Mexicans | 0.0 /100 | #333 | Tragic 27.1% |
| Arapaho | 0.0 /100 | #334 | Tragic 26.6% |
| Natives/Alaskans | 0.0 /100 | #335 | Tragic 26.3% |
| Immigrants | Mexico | 0.0 /100 | #336 | Tragic 26.1% |
| Inupiat | 0.0 /100 | #337 | Tragic 25.8% |
| Pueblo | 0.0 /100 | #338 | Tragic 25.5% |
| Hopi | 0.0 /100 | #339 | Tragic 25.3% |
| Lumbee | 0.0 /100 | #340 | Tragic 24.8% |
| Yuman | 0.0 /100 | #341 | Tragic 24.5% |
| Yakama | 0.0 /100 | #342 | Tragic 24.5% |
| Tohono O'odham | 0.0 /100 | #343 | Tragic 24.4% |
| Navajo | 0.0 /100 | #344 | Tragic 23.6% |
| Pima | 0.0 /100 | #345 | Tragic 23.2% |
| Houma | 0.0 /100 | #346 | Tragic 21.4% |
| Yup'ik | 0.0 /100 | #347 | Tragic 19.4% |