Ecuadorian vs Afghan Bachelor's Degree
COMPARE
Ecuadorian
Afghan
Bachelor's Degree
Bachelor's Degree Comparison
Ecuadorians
Afghans
35.4%
BACHELOR'S DEGREE
6.6/ 100
METRIC RATING
227th/ 347
METRIC RANK
40.8%
BACHELOR'S DEGREE
96.2/ 100
METRIC RATING
114th/ 347
METRIC RANK
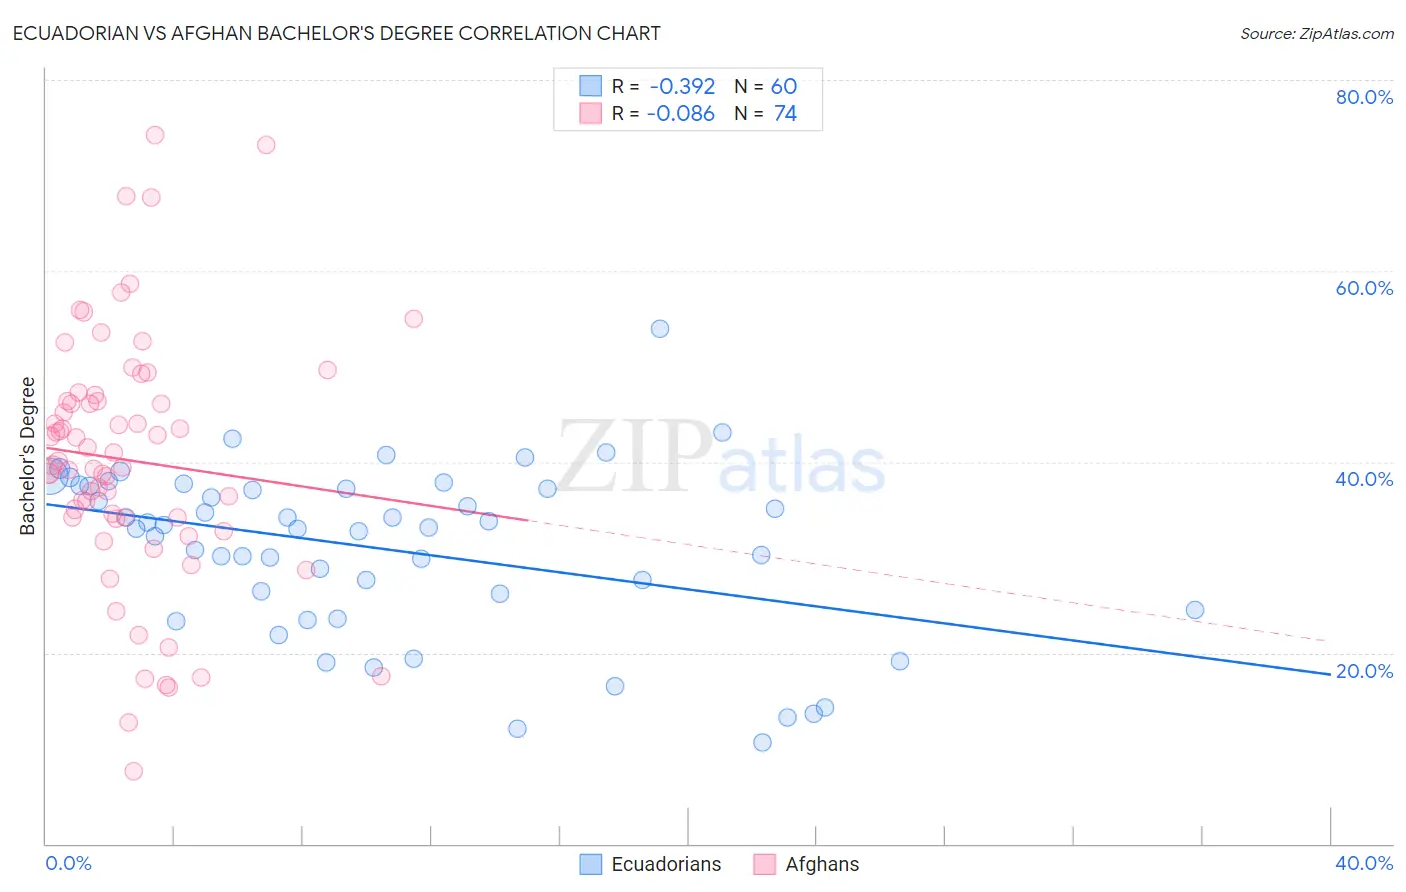
Ecuadorian vs Afghan Bachelor's Degree Correlation Chart
The statistical analysis conducted on geographies consisting of 317,830,457 people shows a mild negative correlation between the proportion of Ecuadorians and percentage of population with at least bachelor's degree education in the United States with a correlation coefficient (R) of -0.392 and weighted average of 35.4%. Similarly, the statistical analysis conducted on geographies consisting of 148,869,794 people shows a slight negative correlation between the proportion of Afghans and percentage of population with at least bachelor's degree education in the United States with a correlation coefficient (R) of -0.086 and weighted average of 40.8%, a difference of 15.3%.
Bachelor's Degree Correlation Summary
| Measurement | Ecuadorian | Afghan |
| Minimum | 10.6% | 7.6% |
| Maximum | 53.9% | 74.2% |
| Range | 43.3% | 66.6% |
| Mean | 30.9% | 40.2% |
| Median | 33.1% | 39.8% |
| Interquartile 25% (IQ1) | 25.3% | 34.1% |
| Interquartile 75% (IQ3) | 37.4% | 46.4% |
| Interquartile Range (IQR) | 12.1% | 12.3% |
| Standard Deviation (Sample) | 8.9% | 13.3% |
| Standard Deviation (Population) | 8.8% | 13.2% |
Similar Demographics by Bachelor's Degree
Demographics Similar to Ecuadorians by Bachelor's Degree
In terms of bachelor's degree, the demographic groups most similar to Ecuadorians are Immigrants from Trinidad and Tobago (35.3%, a difference of 0.23%), Portuguese (35.5%, a difference of 0.26%), Immigrants from Burma/Myanmar (35.5%, a difference of 0.30%), White/Caucasian (35.3%, a difference of 0.31%), and Immigrants from Barbados (35.5%, a difference of 0.37%).
| Demographics | Rating | Rank | Bachelor's Degree |
| Spanish | 9.6 /100 | #220 | Tragic 35.8% |
| Dutch | 9.2 /100 | #221 | Tragic 35.7% |
| Trinidadians and Tobagonians | 8.8 /100 | #222 | Tragic 35.7% |
| French Canadians | 8.3 /100 | #223 | Tragic 35.6% |
| Immigrants | Barbados | 7.5 /100 | #224 | Tragic 35.5% |
| Immigrants | Burma/Myanmar | 7.3 /100 | #225 | Tragic 35.5% |
| Portuguese | 7.2 /100 | #226 | Tragic 35.5% |
| Ecuadorians | 6.6 /100 | #227 | Tragic 35.4% |
| Immigrants | Trinidad and Tobago | 6.0 /100 | #228 | Tragic 35.3% |
| Whites/Caucasians | 5.9 /100 | #229 | Tragic 35.3% |
| Immigrants | Grenada | 4.3 /100 | #230 | Tragic 35.0% |
| Immigrants | St. Vincent and the Grenadines | 4.3 /100 | #231 | Tragic 35.0% |
| Hmong | 3.4 /100 | #232 | Tragic 34.8% |
| Immigrants | Ecuador | 3.3 /100 | #233 | Tragic 34.7% |
| Guamanians/Chamorros | 3.0 /100 | #234 | Tragic 34.6% |
Demographics Similar to Afghans by Bachelor's Degree
In terms of bachelor's degree, the demographic groups most similar to Afghans are Brazilian (40.8%, a difference of 0.030%), Ugandan (40.8%, a difference of 0.070%), Immigrants from Chile (40.8%, a difference of 0.12%), Albanian (40.9%, a difference of 0.16%), and Arab (40.9%, a difference of 0.24%).
| Demographics | Rating | Rank | Bachelor's Degree |
| Northern Europeans | 96.8 /100 | #107 | Exceptional 41.0% |
| Ukrainians | 96.6 /100 | #108 | Exceptional 40.9% |
| Arabs | 96.6 /100 | #109 | Exceptional 40.9% |
| Albanians | 96.5 /100 | #110 | Exceptional 40.9% |
| Immigrants | Chile | 96.4 /100 | #111 | Exceptional 40.8% |
| Ugandans | 96.3 /100 | #112 | Exceptional 40.8% |
| Brazilians | 96.3 /100 | #113 | Exceptional 40.8% |
| Afghans | 96.2 /100 | #114 | Exceptional 40.8% |
| Palestinians | 95.8 /100 | #115 | Exceptional 40.7% |
| Immigrants | Uganda | 95.7 /100 | #116 | Exceptional 40.7% |
| Austrians | 95.5 /100 | #117 | Exceptional 40.6% |
| Croatians | 95.5 /100 | #118 | Exceptional 40.6% |
| Immigrants | Syria | 94.9 /100 | #119 | Exceptional 40.5% |
| Venezuelans | 94.7 /100 | #120 | Exceptional 40.5% |
| Moroccans | 94.6 /100 | #121 | Exceptional 40.5% |