Immigrants from Africa vs Senegalese Bachelor's Degree
COMPARE
Immigrants from Africa
Senegalese
Bachelor's Degree
Bachelor's Degree Comparison
Immigrants from Africa
Senegalese
38.9%
BACHELOR'S DEGREE
76.5/ 100
METRIC RATING
151st/ 347
METRIC RANK
37.5%
BACHELOR'S DEGREE
42.2/ 100
METRIC RATING
183rd/ 347
METRIC RANK
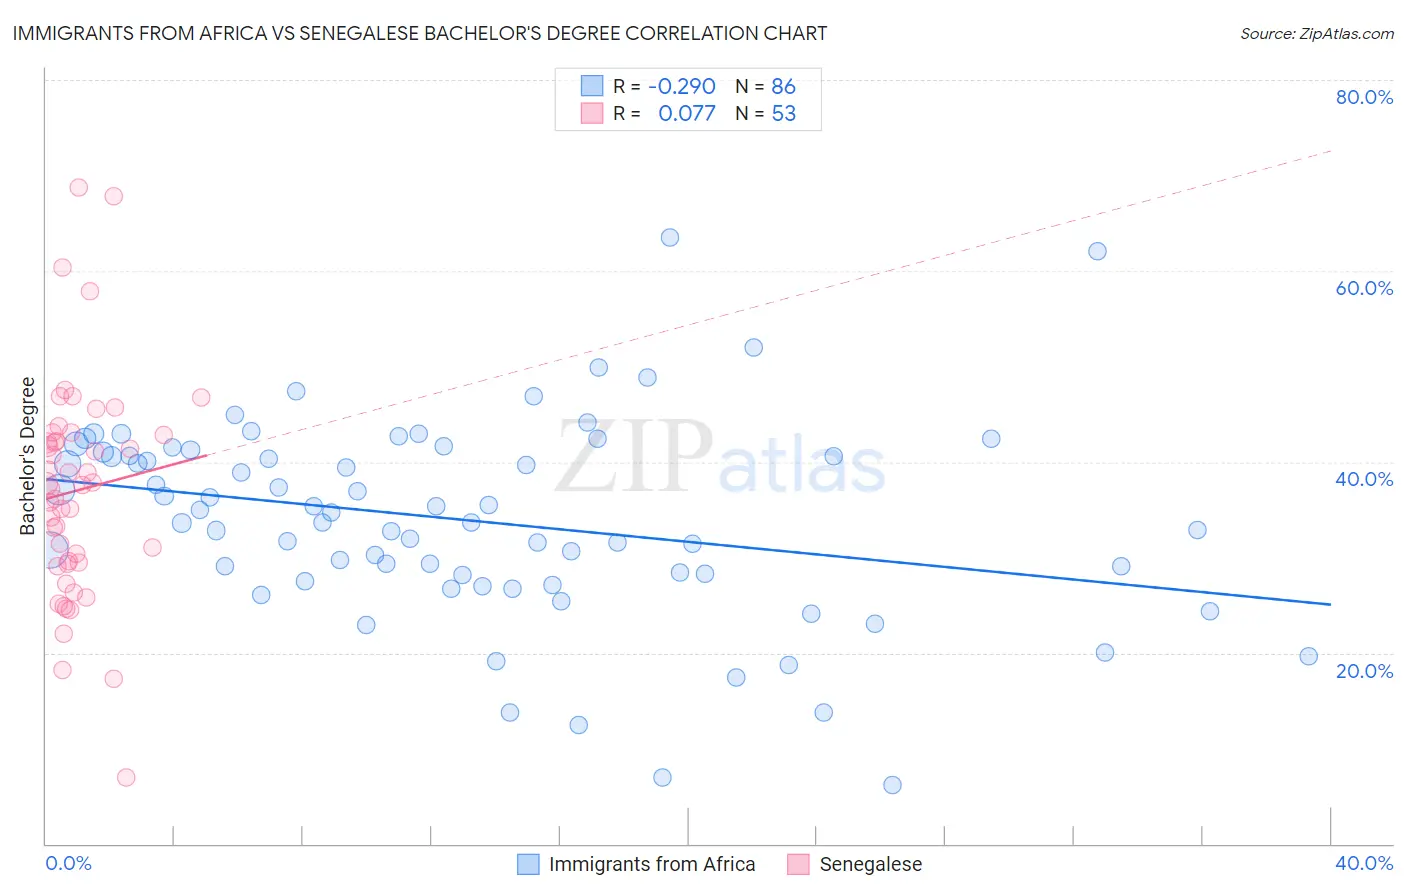
Immigrants from Africa vs Senegalese Bachelor's Degree Correlation Chart
The statistical analysis conducted on geographies consisting of 469,379,940 people shows a weak negative correlation between the proportion of Immigrants from Africa and percentage of population with at least bachelor's degree education in the United States with a correlation coefficient (R) of -0.290 and weighted average of 38.9%. Similarly, the statistical analysis conducted on geographies consisting of 78,136,633 people shows a slight positive correlation between the proportion of Senegalese and percentage of population with at least bachelor's degree education in the United States with a correlation coefficient (R) of 0.077 and weighted average of 37.5%, a difference of 3.7%.
Bachelor's Degree Correlation Summary
| Measurement | Immigrants from Africa | Senegalese |
| Minimum | 6.2% | 6.9% |
| Maximum | 63.5% | 68.8% |
| Range | 57.3% | 61.9% |
| Mean | 33.9% | 37.0% |
| Median | 34.2% | 37.6% |
| Interquartile 25% (IQ1) | 28.2% | 29.4% |
| Interquartile 75% (IQ3) | 41.0% | 42.9% |
| Interquartile Range (IQR) | 12.9% | 13.5% |
| Standard Deviation (Sample) | 10.5% | 11.6% |
| Standard Deviation (Population) | 10.4% | 11.5% |
Similar Demographics by Bachelor's Degree
Demographics Similar to Immigrants from Africa by Bachelor's Degree
In terms of bachelor's degree, the demographic groups most similar to Immigrants from Africa are Sudanese (38.9%, a difference of 0.020%), Slavic (38.9%, a difference of 0.080%), South American (38.9%, a difference of 0.10%), Immigrants from Poland (39.0%, a difference of 0.13%), and Canadian (38.8%, a difference of 0.20%).
| Demographics | Rating | Rank | Bachelor's Degree |
| Immigrants | Afghanistan | 79.7 /100 | #144 | Good 39.1% |
| Slovenes | 79.5 /100 | #145 | Good 39.1% |
| Swedes | 79.2 /100 | #146 | Good 39.1% |
| Immigrants | Sierra Leone | 79.0 /100 | #147 | Good 39.0% |
| Iraqis | 78.1 /100 | #148 | Good 39.0% |
| Immigrants | Poland | 77.5 /100 | #149 | Good 39.0% |
| South Americans | 77.3 /100 | #150 | Good 38.9% |
| Immigrants | Africa | 76.5 /100 | #151 | Good 38.9% |
| Sudanese | 76.4 /100 | #152 | Good 38.9% |
| Slavs | 75.9 /100 | #153 | Good 38.9% |
| Canadians | 75.0 /100 | #154 | Good 38.8% |
| Immigrants | Kenya | 73.8 /100 | #155 | Good 38.8% |
| Kenyans | 72.5 /100 | #156 | Good 38.7% |
| Immigrants | South America | 70.1 /100 | #157 | Good 38.6% |
| Immigrants | Germany | 69.6 /100 | #158 | Good 38.6% |
Demographics Similar to Senegalese by Bachelor's Degree
In terms of bachelor's degree, the demographic groups most similar to Senegalese are Scandinavian (37.5%, a difference of 0.040%), Immigrants from Peru (37.5%, a difference of 0.080%), Immigrants from Bosnia and Herzegovina (37.6%, a difference of 0.13%), Immigrants from Senegal (37.6%, a difference of 0.16%), and Norwegian (37.5%, a difference of 0.18%).
| Demographics | Rating | Rank | Bachelor's Degree |
| Costa Ricans | 47.6 /100 | #176 | Average 37.7% |
| Basques | 47.4 /100 | #177 | Average 37.7% |
| Immigrants | Cameroon | 46.8 /100 | #178 | Average 37.7% |
| Immigrants | Colombia | 45.4 /100 | #179 | Average 37.7% |
| Irish | 44.3 /100 | #180 | Average 37.6% |
| Immigrants | Senegal | 43.8 /100 | #181 | Average 37.6% |
| Immigrants | Bosnia and Herzegovina | 43.4 /100 | #182 | Average 37.6% |
| Senegalese | 42.2 /100 | #183 | Average 37.5% |
| Scandinavians | 41.7 /100 | #184 | Average 37.5% |
| Immigrants | Peru | 41.3 /100 | #185 | Average 37.5% |
| Norwegians | 40.4 /100 | #186 | Average 37.5% |
| English | 39.7 /100 | #187 | Fair 37.4% |
| Immigrants | Oceania | 37.3 /100 | #188 | Fair 37.3% |
| Slovaks | 36.9 /100 | #189 | Fair 37.3% |
| Swiss | 34.1 /100 | #190 | Fair 37.2% |