Puerto Rican vs Senegalese Bachelor's Degree
COMPARE
Puerto Rican
Senegalese
Bachelor's Degree
Bachelor's Degree Comparison
Puerto Ricans
Senegalese
31.0%
BACHELOR'S DEGREE
0.1/ 100
METRIC RATING
289th/ 347
METRIC RANK
37.5%
BACHELOR'S DEGREE
42.2/ 100
METRIC RATING
183rd/ 347
METRIC RANK
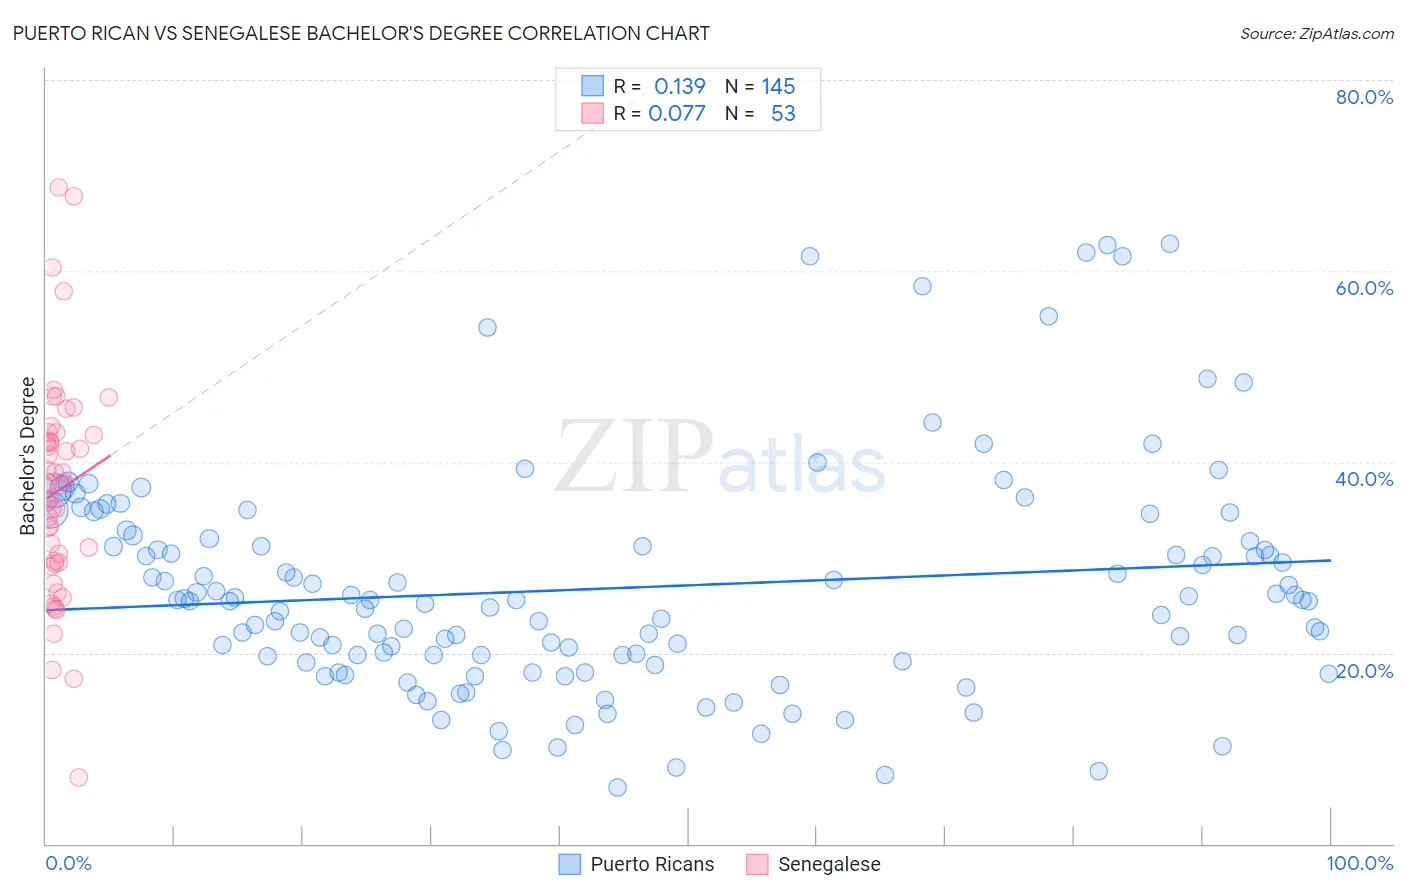
Puerto Rican vs Senegalese Bachelor's Degree Correlation Chart
The statistical analysis conducted on geographies consisting of 528,221,445 people shows a poor positive correlation between the proportion of Puerto Ricans and percentage of population with at least bachelor's degree education in the United States with a correlation coefficient (R) of 0.139 and weighted average of 31.0%. Similarly, the statistical analysis conducted on geographies consisting of 78,136,633 people shows a slight positive correlation between the proportion of Senegalese and percentage of population with at least bachelor's degree education in the United States with a correlation coefficient (R) of 0.077 and weighted average of 37.5%, a difference of 21.3%.
Bachelor's Degree Correlation Summary
| Measurement | Puerto Rican | Senegalese |
| Minimum | 5.9% | 6.9% |
| Maximum | 62.9% | 68.8% |
| Range | 57.0% | 61.9% |
| Mean | 26.8% | 37.0% |
| Median | 25.4% | 37.6% |
| Interquartile 25% (IQ1) | 19.4% | 29.4% |
| Interquartile 75% (IQ3) | 31.8% | 42.9% |
| Interquartile Range (IQR) | 12.4% | 13.5% |
| Standard Deviation (Sample) | 11.7% | 11.6% |
| Standard Deviation (Population) | 11.7% | 11.5% |
Similar Demographics by Bachelor's Degree
Demographics Similar to Puerto Ricans by Bachelor's Degree
In terms of bachelor's degree, the demographic groups most similar to Puerto Ricans are Immigrants from Honduras (30.9%, a difference of 0.040%), Black/African American (30.9%, a difference of 0.080%), Guatemalan (31.0%, a difference of 0.14%), Ute (30.9%, a difference of 0.16%), and Cape Verdean (30.9%, a difference of 0.26%).
| Demographics | Rating | Rank | Bachelor's Degree |
| Immigrants | Caribbean | 0.1 /100 | #282 | Tragic 31.4% |
| Hondurans | 0.1 /100 | #283 | Tragic 31.3% |
| Haitians | 0.1 /100 | #284 | Tragic 31.3% |
| Aleuts | 0.1 /100 | #285 | Tragic 31.3% |
| Immigrants | El Salvador | 0.1 /100 | #286 | Tragic 31.3% |
| Ottawa | 0.1 /100 | #287 | Tragic 31.1% |
| Guatemalans | 0.1 /100 | #288 | Tragic 31.0% |
| Puerto Ricans | 0.1 /100 | #289 | Tragic 31.0% |
| Immigrants | Honduras | 0.1 /100 | #290 | Tragic 30.9% |
| Blacks/African Americans | 0.1 /100 | #291 | Tragic 30.9% |
| Ute | 0.1 /100 | #292 | Tragic 30.9% |
| Cape Verdeans | 0.1 /100 | #293 | Tragic 30.9% |
| Immigrants | Guatemala | 0.0 /100 | #294 | Tragic 30.8% |
| Immigrants | Dominican Republic | 0.0 /100 | #295 | Tragic 30.7% |
| Puget Sound Salish | 0.0 /100 | #296 | Tragic 30.7% |
Demographics Similar to Senegalese by Bachelor's Degree
In terms of bachelor's degree, the demographic groups most similar to Senegalese are Scandinavian (37.5%, a difference of 0.040%), Immigrants from Peru (37.5%, a difference of 0.080%), Immigrants from Bosnia and Herzegovina (37.6%, a difference of 0.13%), Immigrants from Senegal (37.6%, a difference of 0.16%), and Norwegian (37.5%, a difference of 0.18%).
| Demographics | Rating | Rank | Bachelor's Degree |
| Costa Ricans | 47.6 /100 | #176 | Average 37.7% |
| Basques | 47.4 /100 | #177 | Average 37.7% |
| Immigrants | Cameroon | 46.8 /100 | #178 | Average 37.7% |
| Immigrants | Colombia | 45.4 /100 | #179 | Average 37.7% |
| Irish | 44.3 /100 | #180 | Average 37.6% |
| Immigrants | Senegal | 43.8 /100 | #181 | Average 37.6% |
| Immigrants | Bosnia and Herzegovina | 43.4 /100 | #182 | Average 37.6% |
| Senegalese | 42.2 /100 | #183 | Average 37.5% |
| Scandinavians | 41.7 /100 | #184 | Average 37.5% |
| Immigrants | Peru | 41.3 /100 | #185 | Average 37.5% |
| Norwegians | 40.4 /100 | #186 | Average 37.5% |
| English | 39.7 /100 | #187 | Fair 37.4% |
| Immigrants | Oceania | 37.3 /100 | #188 | Fair 37.3% |
| Slovaks | 36.9 /100 | #189 | Fair 37.3% |
| Swiss | 34.1 /100 | #190 | Fair 37.2% |